This post looks at a couple of intraday trading system ideas using End-of-Day price data and pivot points.
Readers will be aware that I use Amibroker and Norgate Premium Data to construct trading systems and test trading ideas. This data is EOD (end-of-day) which means it contains just the open, high, low, and close prices for each full trading day.
In other words, the data does not include any intraday price quotes, not even at the hourly level. This data is thus perfect for medium-long term trading systems but it is perfectly useless for short-term trading.
…Or is it?
You see, even though we don’t have any intraday price quotes, it is still possible to test some interesting short-term trading ideas. Let’s see how.
Intraday Trading Systems With EOD Data
For quite a long time, I failed to realise that just because we don’t have intraday quotes doesn’t mean we can’t test some short-term ideas.
We have the open, high, low, and close prices available. We are therefore able to buy on the open and sell on the close; a short-term trading idea in itself. We are also able to trade on the close and sell on the open, an overnight trading idea.
So let’s look at some more creative ideas for intraday trading.
Pivot Points
Pivot points are pre-determined levels that many day traders look at to help make trade decisions. They are calculated using the previous day’s price range and consist of the main pivot level, then three support and three resistance levels, placed below and above the pivot respectively.
You can read more about pivots and how they are calculated here. But essentially, pivots are key intraday levels that many traders take notice of. Since pivots are calculated using the previous day’s price action we can use them to test some interesting ideas.
Test One
In test one, we take EOD data for the E-mini S&P 500 futures contract (referred to as ‘&ES’ by Premium Data) and we buy the market whenever it opens below it’s pivot. We sell on the close.
To keep things simple we will use a fixed position size of 1 contract. Point value is set at $50, commission is set at $15 per trade and starting capital is $100,000. (For more information about setting up back-tests for futures using Amibroker see here).
Test one rules:
• If @ES opens below it’s pivot, buy on the open & sell on the close
• Position size = 1 contract, fixed
Following is the code used to calculate the pivot levels:
P = Pivot = Ref((High+Low+Close)/3,-1);

P1 = Ref(H,-1);

L1 = Ref(L,-1);

R1 = P + (p-L1);

S1 = P - (H1-p);

R2 = P + (H1 - L1);

S2 = P - (H1-L1);

R3 = H1 + 2*(P-L1);

S3 = L1 - 2*(H1-P);
Test one results:
As you can see, running this system between 1/1/2002 and 1/1/2014 produced a compounded annual return of 1.98% with a maximum drawdown of -18.87% over 1329 trades.

The win ratio is adequate but the CAR/MDD ratio is not particularly attractive. I then decided to test some other variations of pivots using the same settings. The results are shown below:

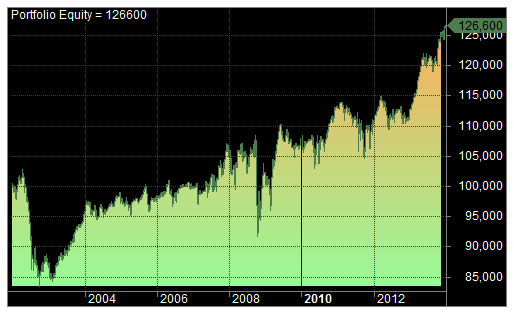
For example, line three buys the E-Mini when it opens below the second support and produced a CAR of 0.21%. As you can see, the best performance came from the original test (open < pivot). So I ran the system in the out-of-sample period between 1/1/2014 and 5/1/2015. The results are shown in the final line of the table above and the equity curve is shown below:
Comments
Buying the market when the market opens under the pivot and selling on the close was the best performing variable. There may be some potential for development by introducing longer holding times, a market filter, or adding extra rules and complexity.
Using (optimistic) commissions of $15 per trade, it is hard to find a simple trading system that works well for the E-Mini future. The E-Mini is a particularly tight market to trade and traders might have more success with more volatile instruments such as the Dow Jones Average, Nasdaq, FTSE 100 or DAX.
Test Two
In test two, we are going to use the same settings as test one and stick with the E-Mini.
This time we are going to buy the index on the open, so long as the open is lower than the pivot AND higher than the second support. If the market touches the third support we will sell at that level, if not, we will sell on the close.
Test two rules:
• If @ES opens between the pivot and second support buy on the open
• If the market trades at or below S3, exit at S3. Otherwise exit on the close
• Position size = 1 contract, fixed
To set this up correctly I used the below formula. The S3 sell price was rounded to the nearest integer since the E-Mini has a tick size of 0.25. There is probably a better way to do it.
Buy = O<P AND O>S2;

Sell = C;

S3price = round(S3);

BuyPrice = O;

SellPrice = IIf(L<=S3,S3price,C);
Test two results
Running the test on the E-Mini between 1/1/2002 and 1/1/2014 returned a CAR of 1.63% with a maximum drawdown of -21.79%% from 1318 trades.
The system was run out-of-sample and produced a CAR of 3.98% with a maximum drawdown of -6.84% from 122 trades. The equity curve for the OOS period is shown below:
Comments
Test two performed better in the out-of-sample period than in the in-sample period albeit with fewer trades. There may be some potential for development by adding extra rules and experimenting with different levels of risk. Again, the E-Mini might not be the best contract to test. Maybe a commodity such as gold or crude oil would do better.
Test Three
In our final test, we are going to return to the rules shown in test one but we are going to test them on stocks from the S&P 100 universe and we will not be using any margin. Instead, we will use a starting capital of $100,000 and allocate 20% of capital to each trade.
This time, whenever a stock opens below the first support, we will buy on the open with 20% of our capital and sell on the close. Commissions are set at $0.01 per share and only 1 trade can be made at a time. Some extra conditions are used for liquidity purposes.
Test three rules:
• If a stock opens below it’s pivot buy on the open and sell on the close
• Universe: S&P 100 including historical constituents
• Position size = 20%
• Starting capital = $100,000
• Portfolio size = 1
• Liquidity rule = open price is greater than $1
• Liquidity rule = 25-day average volume is greater than 100000
• Commissions = $0.01 per share
Test three results:
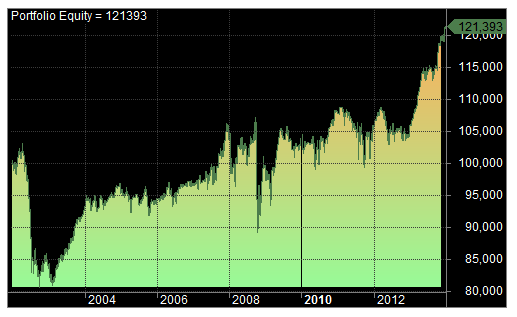
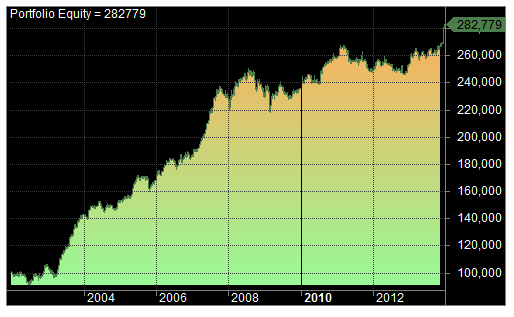
Running the test between 1/1/2002 and 1/1/2014, returned the following results and equity curve:
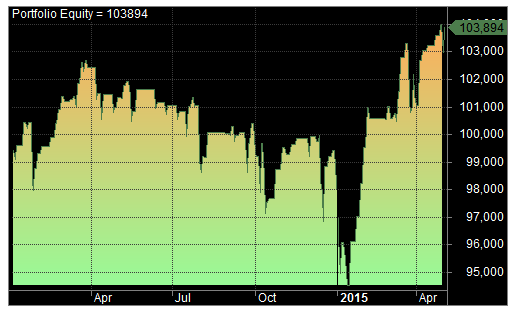
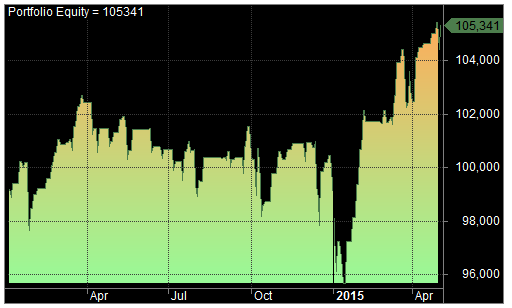
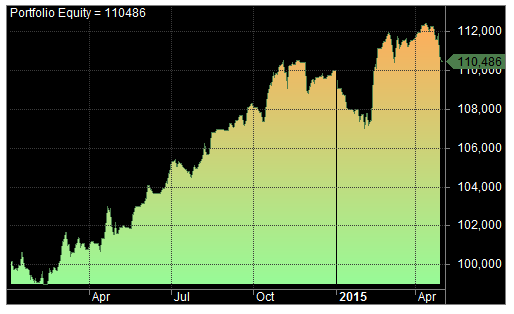
Here is the out-of-sample equity curve for 1/1/2014 – 5/1/2015:
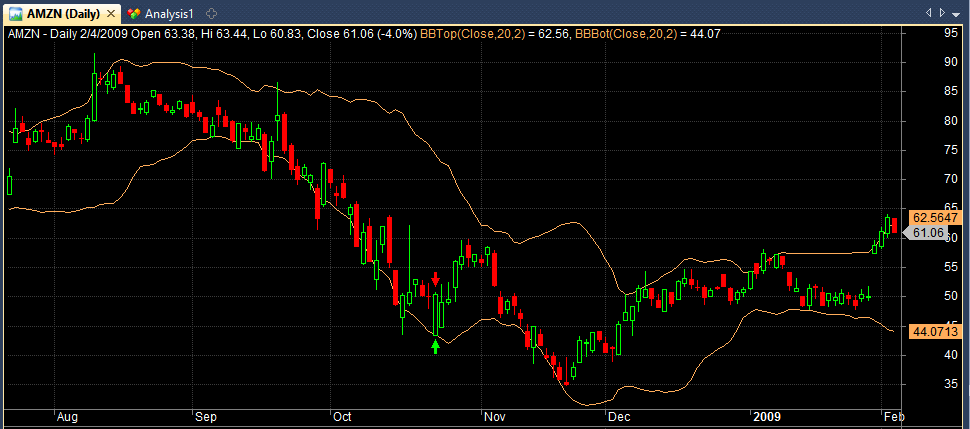
The best performing trade in-sample was Amazon $AMZN which was bought on the 23rd October 2008 (trade shown by the green arrow):
Comments
The results from test three show potential for further development, which could come in the form of longer holding periods, improved ranking mechanism, adding a market timing filter, additional complexity and different position sizing.
The results suggest that trading individual stocks might be easier than trading futures contracts such as the E-Mini and this could be because individual stocks are likely to be less efficient than high volume futures markets.
Conclusion & Criticisms
So far, there has been limited stress-testing applied to these trading ideas. Monte-carlo analysis would be beneficial and we should also test more stringent slippage.
A Warning!
By making some adjustments to position sizing on strategy three it is possible to get some extraordinary returns (50%-70% CAR with only minor drawdown) but be warned.
The problem with test three is that it relies on getting accurate price fills on the open, which is not always an easy task. Bid/Ask spreads often widen on the open so (depending on the liquidity of the stock) it is necessary to increase slippage estimates. In order to do so, I recommend setting commissions from 0.2% or 0.5% up to 1% per trade and re-running the system.
Unfortunately, estimating the correct amount of slippage to use is not an easy task since bid/ask spreads change throughout the day, as liquidity increases and decreases. For some high volume stocks, the spread can be as low as 0.05% each way but for others (such as penny stocks) it can be as high as 20%!
So when you test strategies like this, make a note of the bid/ask spreads and make sure you have realistic assumptions about the stocks you plan to trade and the likely slippage you will face.
My advice would be to be conservative with slippage estimates and also, use some discretion when taking signals. If a stock opens below S2 on some very bad news, then you’re probably better off ignoring the signal. On the upper hand, if it opens lower than S2 for no apparent reason, that might be a good signal to take.
Scan pre-market
Also, where test three is concerned, you need to be able to scan for entries from a broad number of stocks, right on the open. Looking for setups in the pre-market and executing them with a MOO order is a consideration which might be worth further investigation and this is something that may be possible with the scanning tools at Interactive Brokers.
Rounding up
Overall, the main point of this article was to introduce some ideas about how to trade intraday using EOD data and I hope I have stirred your imagination a little.
There are hundreds more ideas that could be tested. Such as using the previous day’s bottom Bollinger Band as a level to buy. Or perhaps the previous day’s moving average level.
Or, we could try a trend following system by specifying our intraday buy price as the high of x number of bars ago. If you happen to try any such ideas yourself, please let me know in the comments.
Ref((High+Low+Close)/3,-1)
in the line above, what is the meaning of ” Ref() ”
or
what does it mean — Ref()
thanks & regards
Ref is used to ‘reference’ previous or future bars. For example Ref(C,-1) returns the previous bar’s close.
Unfortunately, I noticed that Open prices usually include prices from pre-market which are usually not used by retail investors.
For example, Apple (AAPL) open price on 28/12/2018 was $155 according to Norgate data.
However, when I check the price using IQFeed, I see that the price of $155 was on 28/12/2018 at 4 AM.
But the actual price on market open at 9:30 AM was $157.25.
This problem is probably affecting all EOD strategies that use Open price 🙁
I don’t think that is correct. There is a difference between the open auction price and the consolidated price reported by some vendors. Many vendors (not Norgate) show consolidated price which is an amalgamation and does not reflect actual trade price. My real time fills are nearly always the same as reported by Norgate data so I believe it to be a high quality source.
Hello,
Thanks for the great insights. Can you share with us the full AFL of this strategy. And also as you mentioned above can we see this strategy with buying on close and sell on open?
There is a pivot points strategy included in our research package. Thanks
can you share your afl code.