There are a number of different ways to trade cryptocurrencies. You can invest for the long term (aka hodl), you can day trade, or you can build your own quantitative crypto investment strategy.
My preference has always been to trade strategies that are backed by data and show a positive edge in historical simulations. However, I have always found this hard for crypto because there isn’t that much quality data available. I also realize that any strategy will necessarily have a hard time beating buy and hold on bitcoin.
Nevertheless, data is getting better all the time and cryptocurrencies offer plenty of opportunities. In the rest of this article I will talk about a process for building your own crypto trading strategies and then test six simple ideas. This will help us understand which trading styles work best for cryptocurrencies.
How To Build A Crypto Investment Strategy
Let’s take a look at the steps needed to build a crypto investment strategy.
#1 Think Of A Plan
The first step to building a crypto trading strategy is to sit down and think carefully about what you want to do. There is no point jumping in and testing data without a solid plan in hand.
Think about what are you going to test and how are you going to test it. What are your beliefs around crypto and what answers are you hoping to find.
If you don’t have a careful plan, your analysis will be disorganized and lack rigor. This will affect your trading results and confidence so have a plan and be prepared.
#2 Obtain Crypto Data
The next step is to obtain some decent historical data that you can backtest your trading ideas with. Cryptocurrencies have not been around all that long but the data is getting cleaner and more plentiful every day.
For the purposes of this article, I have decided to go with data from Brave New Coin which is available on Nasdaq Data Link. The data contains historical daily prices for 1500+ cryptocurrencies and 6000+ currency pairs going back to April 2014.
From what I can see the data is good quality and is affordable at around $40 a month.
#3. Format The Data
Once you have the data, check it for any errors then format it for your preferred backtesting platform.
I downloaded data for 1817 cryptocurrencies from Brave New Coin. I downloaded each cryptocurrency into its own individual CSV file and then imported that into Amibroker using the Import Wizard.
#4. Begin Testing Ideas
Once the data is in the backtesting software you can get to work designing your trading rules and testing out your ideas. At this point, some knowledge about cryptocurrencies comes in useful for designing the crypto trading strategy that you want to test.
It’s also important to stick to best practices regarding system development.
For me, this means:
- Always leaving some data out-of-sample for validation purposes.
- Using simple rules and minimal optimization in order to reduce the possibility of curve fitting.
- Looking for large sample sizes conducive to the law of large numbers.
- Using common sense rules that are rational and not just data mined patterns.
There is more to it, but these are the first principles I rely on to start my analysis.
Once the system development is done I will typically move into live trading and use any feedback from live trading to directly influence further fine tuning of the system.
Six Crypto Trading Strategies
For the rest of this article, I will test six different types of crypto trading strategy. It’s important to note that these are not complete, sophisticated strategies. They are simplistic systems with basic rules.
The idea is to help us understand what type of crypto investment strategy works best for cryptocurrencies. This will help point us in the direction for further research.
The six different systems I am going to test are as follows:
#1. Monthly Momentum
The first system is a rotational, momentum strategy. For this strategy we will rank all the cryptocurrencies and each month buy the 10 best performing cryptocurrencies based on the last 12 month period. This 10 position portfolio will be rebalanced each month.
#2. Monthly Reversal
This crypto trading strategy is the same as the one above. However, this time we will be buying the 10 worst performing cryptocurrencies each month. Again, performance will be based on at 12-month lookback.
#3. Trend Following
This system buys a cryptocurrency when it makes a new 250-day high. It sells when the slope of the 5-day EMA turns negative. A maximum of 10 positions are allowed at any one time.
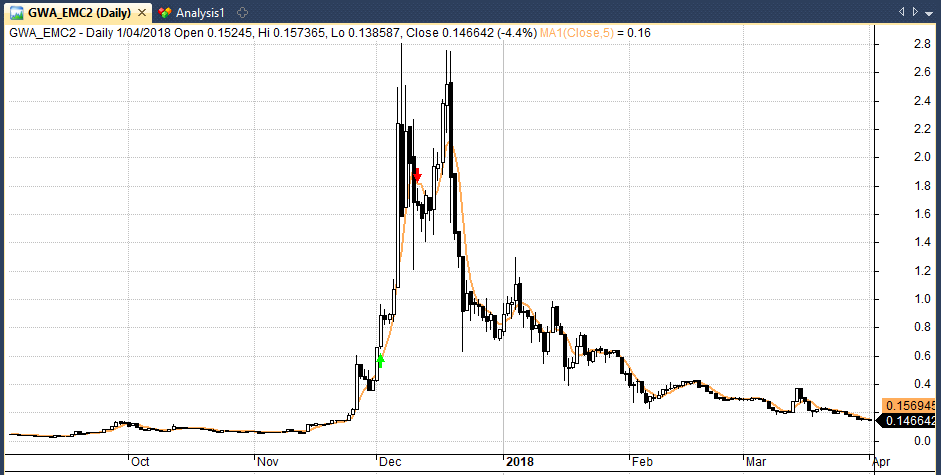
The following chart shows a trade example in a cryptocurrency called Einsteinium (EMC2). The green arrow represents our buy signal and the red arrow shows our sell signal.
#4. Mean Reversion
This system buys a cryptocurrency when the RSI(3) indicator drops below 10 so long as the price is also above the 200-day moving average. This is a classic mean reversion signal that buys oversold securities that are still in long-term upward trends. A maximum of 10 positions are allowed at any one time.
#5. Volatility Breakout
This system buys a cryptocurrency when the 20-day normalized ATR (average true range) hits a new 5-day high and price hits a new 25-day high. It sells when the 20-day normalized ATR hits a new 50-day low. A maximum of 10 positions are allowed at any one time.
#6. Volatility Squeeze
This system buys a cryptocurrency when the 20-day normalized ATR (average true range) hits a new 50-day low and price hits a new 25-day high. It sells when the 20-day normalized ATR hits a new 5-day high. A maximum of 10 positions are allowed at any one time.
Liquidity Rule
In order to avoid some of the really illiquid and unknown cryptocurrencies I also introduced a liquidity rule that prevents us buying any crypto with a daily volume less than $100k and a price under $0.50.
Crypto Backtest Results
The above strategies were applied to all cryptocurrencies in our database between January 2014 to January 2021 with a daily volume more than $100,000 and a price over $0.50. We began with a starting capital of $50k and simulated commissions of 0.2% per trade.
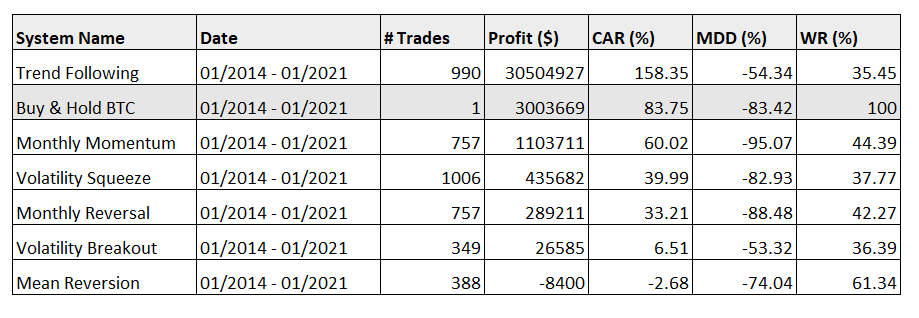
The following table shows the results of our analysis:
Observations
As you can see from the results above, the best performing strategy was the trend following system based on the 250-day breakout and the 5-day EMA.
This system produced an annualised return of 158.35% over 990 trades with a maximum drawdown of -54% and a win rate of 35.45%. This resulted in a net profit of over $30 million dollars.
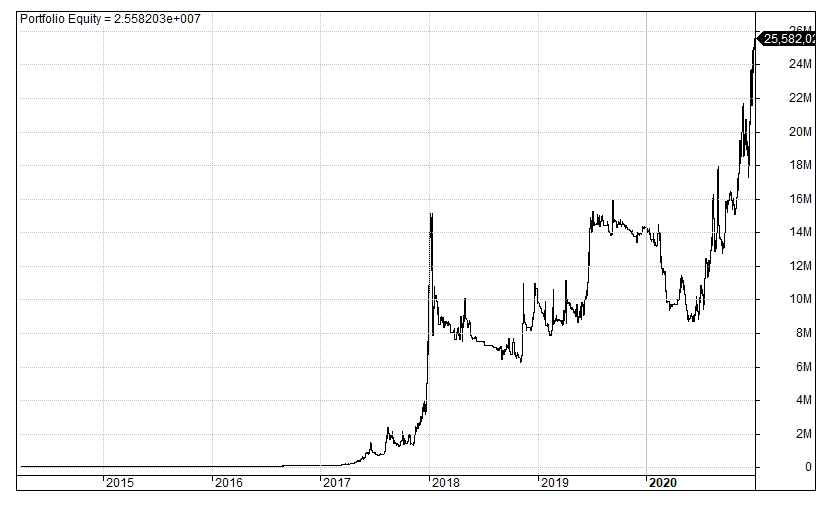
The following chart produced in Amibroker shows the equity curve produced by this crypto trend following system:
The trend following system outperformed the bitcoin buy and hold return (83.75% CAR) and it also did so with lower risk. However, you can see that all our other strategies failed to beat the bitcoin buy and hold. The mean reversion system was the worst performing system producing a loss of -$8400 over the period.
The monthly momentum system performed reasonably well, however, the annual return and maximum drawdown were still worse than the bitcoin buy and hold.
Conclusions
Because I am not an expert in cryptocurrencies I don’t feel comfortable making too strong conclusions from these results. However, I think we can take some useful insights away from this analysis.
By applying some simplistic trading strategies to a large database of cryptocurrencies we found that most strategies failed to beat the buy and hold bitcoin return.
The only strategy that beat buy and hold was the trend following system. That system produced a staggering net profit that was 10 times larger than buy and hold.
These results are not particularly surprising. The huge and explosive run up in cryptocurrencies is bound to be more suited to a trend following approach that rewards long tail returns.
Conversely, mean reversion strategies tend to perform better on more stable, liquid securities. Cryptocurrencies display erratic price movement and are not suited to mean reversion. The mean reversion strategy could probably be improved by removing some of the smaller cryptocurrencies and only trading the larger cap coins.
The huge return from trend following is enticing, however, it should be balanced by the possibilities of curve fitting and hindsight bias. It is easy for a trend following strategy to perform well on an asset class that has seen such explosive growth in the past.
Whether or not this growth will continue in the future is a completely different question. If the cryptocurrency bubble bursts then none of the strategies discussed are likely to provide good returns. Trend following looks like the best approach for a crypto investment strategy but further research is needed.


How do you come up with these time frames for technical indicators (250-day high, 5-day EMA as examples)? Are they chosen arbitrarily?
I began with the 250-day high then tested a few different exit types. 50-day EMA was too slow and 20% trailing stop loss wasn’t effective. Looked at the price action and decided to settle on a 5-day EMA.
Hi Joe, great work as usual.
How did you normalized the ATR, By price or you normalize the True range itself and then calculate the ATR
ATRP = (ATR(20)/C)*100;