Monte Carlo analysis involves the use of algorithms to generate random repeated sampling of results. Typically, Monte Carlo is used to run a large number of simulations in order to find the likely probability distribution of an unknown event.
Monte Carlo Analysis For Trading Systems
 For trading system developers, Monte Carlo analysis can be useful in several instances.
First, Monte Carlo can be used to analyse the robustness of a trading system. By adding small, random levels of noise to financial data, (such as to the open price) it’s possible to see how the system reacts to small changes. If the system is still profitable when random noise is added to the data, it’s a good sign of robustness.
Adding random noise
Another way to use Monte Carlo analysis is to add random noise, not to the data itself, but to the system parameters that are attempting to trade the data.
For example, if a moving average crossover trading system is shown in back-tests to be optimal with values of 50/200, it should also be profitable with similar values – such as 49/201, 48/200, 46/202 etc.
Monte Carlo can be used to add random noise to the parameters to test whether the system is robust based on the value of parameters.
Varying the sequence
The third way to use Monte Carlo is to vary the sequence of trades that a system makes. This is useful in order to find the worst and best possible scenarios from many different runs.
The idea here isn’t to see what would happen if the system selected different stocks each time, because most traders will have a selective process that always chooses a particular, best ranked stock.
Instead, the idea is to alter the sequence of finished trades many times over.
For a clear example of this, consider a system that encounters a large number of winning trades right at the beginning.
After six months, the system is off to a flier and has produced 20 winning trades already. Three years later, the system is still in good profit, but imagine it has just been on a losing run of 12 bad trades.
But consider what would have happened if those 12 losing trades happened at the beginning instead of at the end. It’s possible that if the sequence was different, the system would have had 12 losing trades straight away and never recovered.
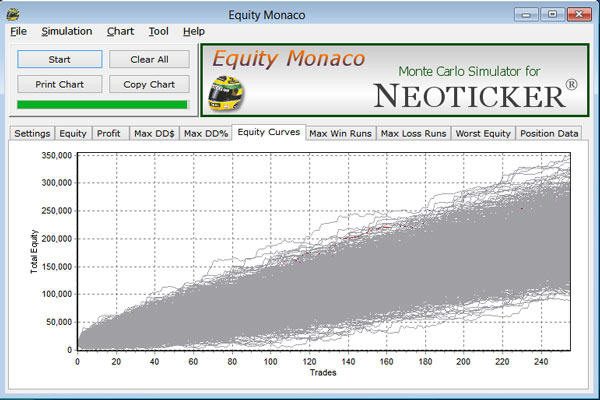
Using Monte Carlo analysis, we can run thousands of random simulations and compare their results. Doing so, we can gain an understanding of what to expect when taking the system live.
And this process can be easily achieved using Amibroker and the free program Equity Monaco.
By taking the trade results of a trading system (preferably out-of-sample results) and loading them into Equity Monaco it’s possible to run thousands of different simulations.
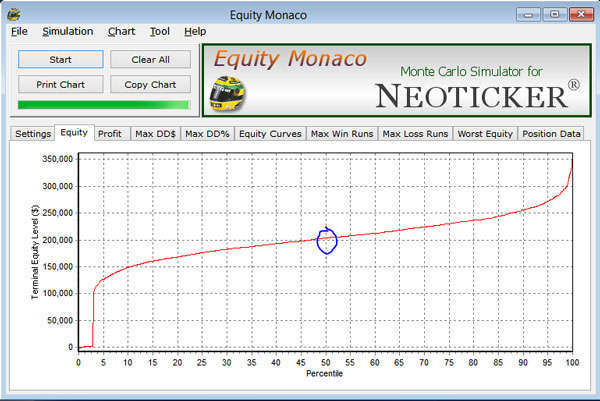
The diagram from Equity Monaco shows the terminal equity level for various runs. 50% of runs made over $200,000 while 90% of runs made $150,000 or more. This is based on a test of 1500 simulations.
For more information about Monte Carlo analysis, I recommend reading the help files from the Equity Monaco software. You should also read Howard Bandy’s books, particularly Quantitative Trading Systems and Modelling System Performance.

