
I’m always on the lookout for interesting ways to time the market. Using a market timing model can help to avoid painful bear markets and indicate when is a good time to buy stocks.
Recently, I was looking at some of the strategies on Allocate Smartly and came across one called Growth Trend Timing.
Growth Trend Timing was originally created by Jesse Livermore from Philosophical Economics. (Not his real name I assume). The strategy attempts to identify recessions through a combination of momentum and fundamental data.
In the rest of this article, I evaluate the Growth Trend Timing model. I then provide our own take on the strategy by adapting it to trade individual US stocks.
Growth Trend Timing Rules
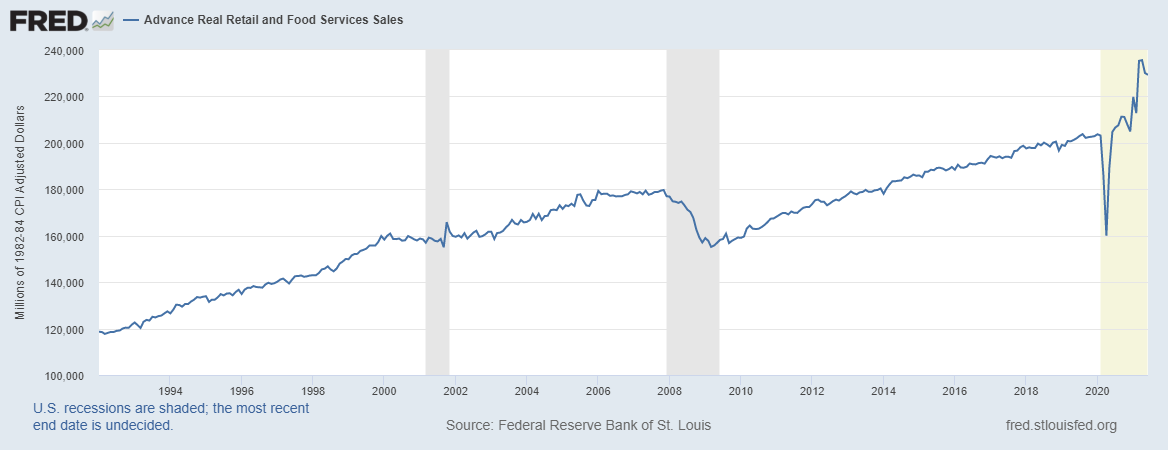
As written on Allocate Smartly, there are two versions of the Growth Trend Timing model. The first (original) version uses Industrial Production data (INDPRO) and Real Retail and Food Services Sales data (RRSFS).
Industrial production measures economic production and retail and food sales measures consumption. Using these indicators together can help predict possible recessions.
This data can be easily found and downloaded from the Federal Reserve of St Louis (FRED) website with the following links:
The second version uses the US unemployment rate (UNRATE) and shows a similar ability to identify recessions. Historical unemployment data can also be downloaded from the FRED website below:

The idea is that when economic data and momentum both signal a recession, the strategy remains in cash and does not invest. When a recession is not signaled then we can invest in SPY, the S&P 500 ETF.
Let’s look at the rules more closely.
Growth Trend Timing Original Version
As mentioned, the original GTT model combines price momentum and economic data. It can be described as follows:
- Look at last month’s data for Real Retail and Food Services Sales (RRSFS) and US Industrial Production (INDPRO). If RRSFS and INDPRO are both lower than they were at the same time last year, a recession is signaled. (The reason we use last month’s data is that data is often restated and we want to avoid any form of lookahead bias).
- If a recession is signaled, next look at the 10-month price average for the SPY. If SPY is trading above its 10-month average then proceed to buy SPY on the last trading day of the month.
- If a recession is not signaled, go long SPY on the last trading day of the month.
- If a recession is signaled and SPY is below it’s 10-month average, exit on the last trading day of the month and wait for the model to exit the recessionary period.
Growth Trend Timing Unemployment Version
The newer GTT model combines price momentum with unemployment data.
- First, look at last month’s US unemployment rate (UNRATE). If last month’s unemployment rate is above the 12-month average unemployment rate, a recession is signaled.
- If a recession is signaled, next look at the 10-month price average for the SPY. If SPY is trading above its 10-month average then go long SPY on the last trading day of the month.
- If a recession is not signaled, go long SPY on the last trading day of the month.
- If a recession is signaled and SPY is below its 10-month average, exit on the last trading day of the month and wait for the model to exit the recessionary period.
Backtest Results
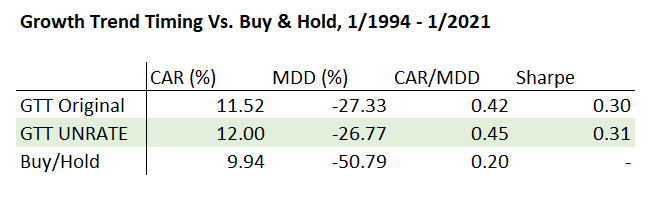
The website Allocate Smartly produced a good return for this strategy and we recorded similarly good results.
As you can see from the statistics and charts below, both versions of GTT outperformed buy and hold. The annualized return is higher and the lower drawdowns make the strategy worthwhile. The unemployment version produced the best result with a return-to-risk score of 0.45.
Growth Trend Timing Model With Individual Stocks
Having a market timing model is not just useful for asset allocation, it is also helpful in developing strategies for individual stocks. If you can avoid investing in stocks during major bear markets, you can significantly increase your annualized returns.
Easier said than done. But the GTT model looks pretty good and we can easily adapt it for a portfolio stock trading strategy.
In the next example, I am keeping the GTT unemployment version as before. But instead of using it to trade SPY we will add some extra rules to buy a portfolio of individual stocks. Following are the rules I came up with:
GTT For Stocks Rules
- First, look at last month’s US unemployment rate (UNRATE). If last months unemployment rate is above the 12-month average unemployment rate, a recession is signaled.
- If a recession is signaled, next look at the 10-month price average for the SPY. If SPY is trading above its 10-month average then rank all S&P 500 stocks according to their combined 3-month, 6-month and 12-month momentum. Then go long the top 50 scoring stocks on the last trading day of the month.
- If a recession is not signaled, rank all S&P 500 stocks according to their combined 3-month, 6-month and 12-month momentum. Then go long the top 50 scoring stocks on the last trading day of the month.
- If a recession is signaled and SPY is below it’s 10-month average, do not buy any stocks and exit all open positions on the last trading day of the month. Wait for the model to signal the end of the recession before entering new positions.
In other words, we are using the same market timing rules as before. But instead of buying SPY we are buying the 50 strongest S&P 500 stocks.
Backtest Results
I first tested this system over an in-sample period between 1/2006 to 1/2018. After some initial testing I then tested it again on the full sample between 1/1994 to 1/2021. The statistics and equity curve are shown below:
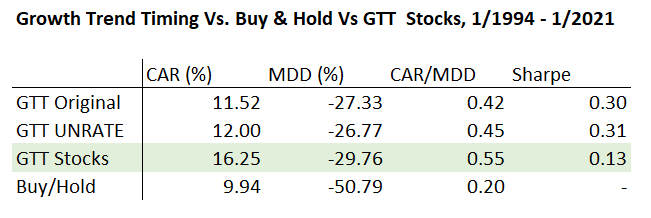
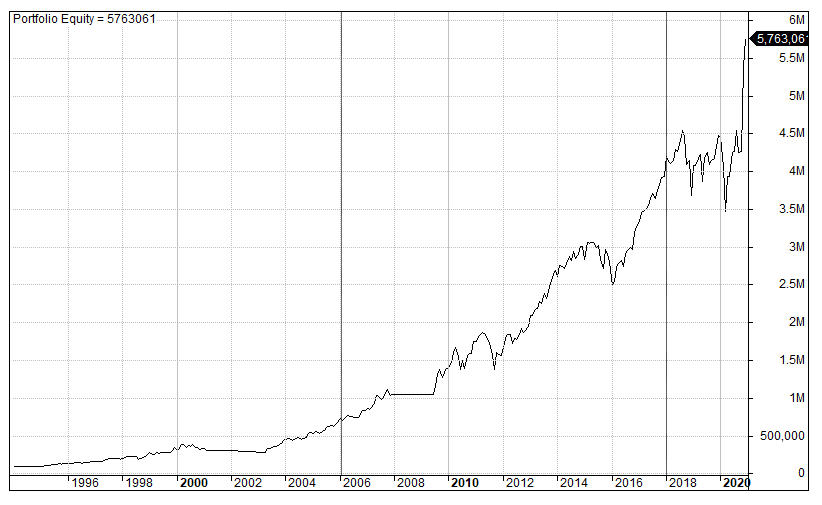
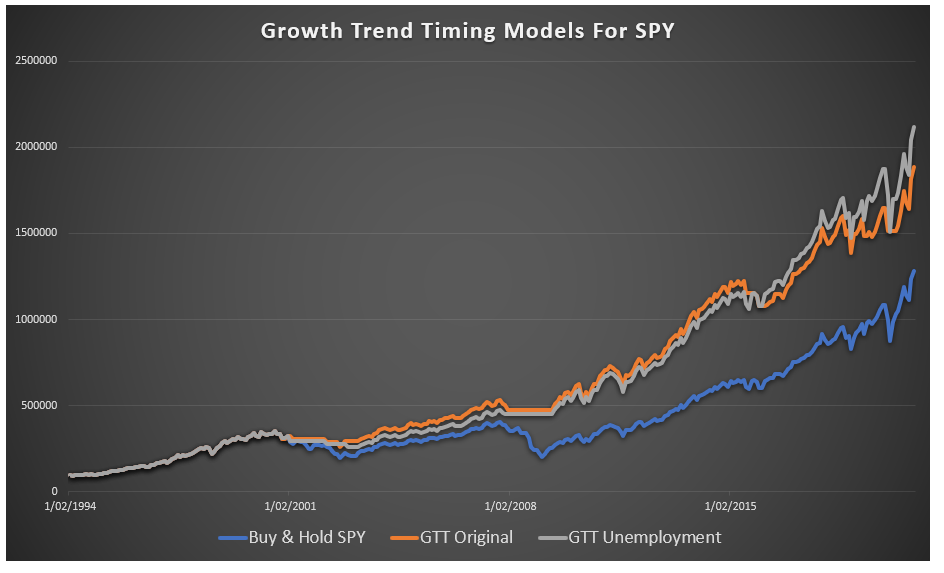
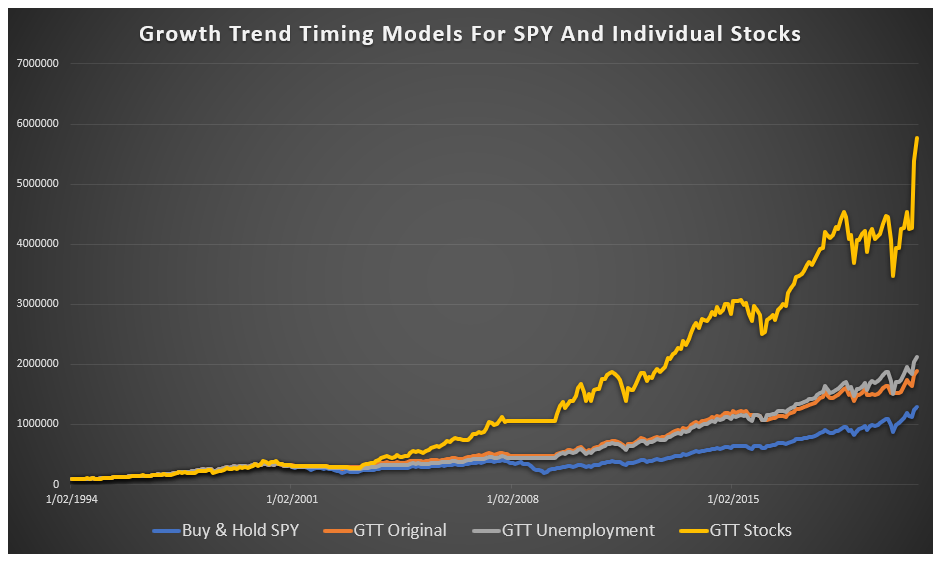
As you can see, adapting the Growth Trend Timing model for individual stocks has been a success. We greatly improved our annualized return to over 16%. The maximum drawdown increased but is still under -30%. This is a manageable drawdown for most long-term investors. The below chart shows how it compares to the previous timing models on SPY:
Final Thoughts
The Growth Trend Timing model is fairly unique in its use of momentum and fundamental data. It’s nice to see that we were able to produce results similar to other sources. This adds credibility to our findings and helps to validate the approach.
We then applied the market timing model to a portfolio strategy of individual stocks and produced even better results. The model is simple and appears relatively robust. The model could be a good alternative to the classic 200-MA rule.
It will be interesting to apply this model to other portfolio strategies and see how risk and return is impacted. For those interested, I will be including another version (with code) in our program Marwood Research.
Notes: Historical stock data for this article comes from Norgate and includes delisted stocks and historical index constituents. Data is adjusted for dividends, corporate actions and includes commissions. Economic data comes from FRED.
Thanks Joe, interesting results
Intersting result. I would like to add some comments and also ask you some questions if you don’t mind:
1) When these recession indicators (INDPRO, UNRATE, etc) are available in the website? If you are using the beginning of the month as a rebalance period, maybe the indicator for the previous month is still not available. Also, if you are rebalancing at the end of the month, you may be risking keeping a position for more days even that your indicator is currently available and a recession is being signaled (which, at least in my point of view, is undersirable).
2) Even that the CAGR of the strategy using stocks is greater, this strategy had a huge loss of sharpe altough the MAR ratio didn’t change that much. Maybe having a smarter allocation between the selected assets (your momentum portfolio) that, for example, equal weights the risks of the assets in the portfolio will deliver better sharpe. If I understood correctly, your portfolio is equal weight in financial terms, but not in risk.
3) Do your backtest consider SPY or other S&P etf or you are using the S&P 500 to backtest your results?
Best and keep the good work!
Positions are entered at the close of the month using previous month’s data. This is to make sure the data is reliable. Maybe it would work even better if you can enter sooner than that. That is something to look into and test.
Yes Sharpe drops. That’s not too concerning for me. Actually the drawdowns are not totally accurate since we are testing on monthly timeframe and some detail that would be shown on daily timeframe is lost. I personally don’t like weighting by risk or volatility but that might be worth trying if it interests you. Sharpe may not be the best metric here.
I am using SPY ETF.
Many thanks for reading!
can you add the model where you compare SPY vs just its 10-month ma? in this way we can see if adding fundamental input does, indeed, add value or not. Thank you
Hi,
Could you give an example of the GTT strategy with actual dates. It’s a bit confusing because the data is usually a month behind so when you say “last month” I don’t know if that’s the most current month available. Maybe walk through a month step by step and list out the specific dates?
It is actually quite straight forward. If today is the 30th of April, we first look at the unemployment data from March (i.e. the previous month). Next we look at the current moving average of the S&P 500.