What Is Trend Following?
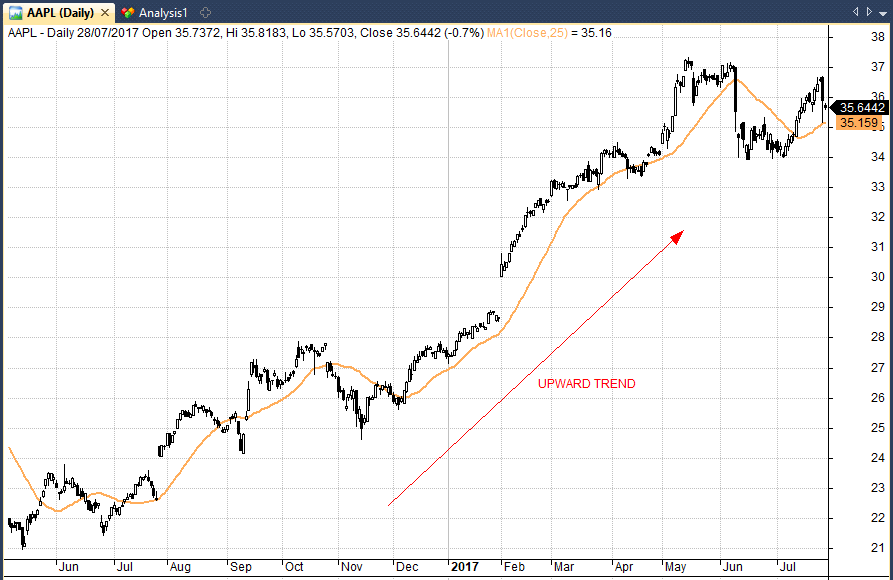
If you look at a selection of charts, it becomes obvious that prices tend to move in particular directions – either up or down – for extended periods of time.
Often, there’s no obvious reason why this is occurring but it is. These are trends, and successful traders generate significant profits by identifying and following them.
Wikipedia says that trend following strategies are based on technical analysis. In reality, I would say this is only partly true.
Technical analysis can include any type of chart analysis or pattern recognition. Trend following, on the other hand, is more systematic and methodical. It relies on simple mathmatics to identify trends and follow them for a suitable period of time.
Trend followers believe that trends exist across numerous markets and industries and that there is a reason for them existing. They believe that the price of a security is the most important thing to understand. Everything you need to know about a market can be ascertained from its price action.
Table Of Contents
- Historical Performance
- The Long Tail
- How To Find A Trend
- Managing Risk
- Does Trend Following Work On Stocks?
- Trend Following Strategy Example
- Famous Trend Followers
- Does Trend Following Still Work?
- Conclusion
Historical Performance
As it turns out, the idea of being able to spot price trends in financial markets is not simply a figment of imagination. Numerous studies have been done to show that trend following strategies have worked for long periods of history.
For example, the well-cited study by hedge fund AQR called A Century of Evidence on Trend Following. This paper lays the groundwork for a momentum trend following strategy all the way back to 1880.
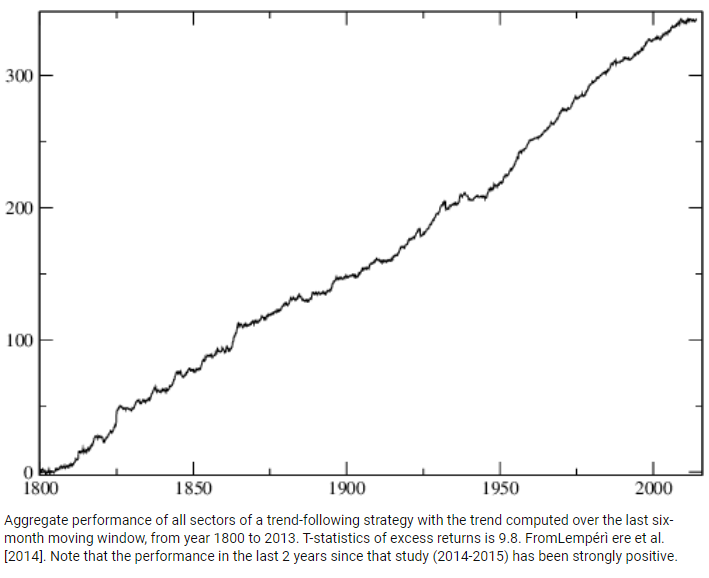
Furthermore, Lemperi and others produced a paper showing strong positive returns back to 1800. This is for a trend following strategy based on a 6-month moving lookback window:
It’s All About Price
To get to grips with trend following it’s necessary to understand the importance of price. Trend followers use technical analysis to identify trends and to determine when to enter the market. They also use price to formulate their exit strategy.
The key tenet of trend analysis – and the mantra of trend followers – is that price can tell investors everything there is to know. It tells them how the stock has performed in the past, where it is now, and what the future is likely to hold.
Because of this, trend followers focus on price movements. They typically disregard fundamental factors such as economic data, business details or geopolitical events.
Trend followers argue that attempting to analyse fundamentals is futile. Everything you need to know about a market it reflected in it’s price.
The price is all you need to know. A market that is going up should be bought, while a market that is going down should be sold. If you consider all the inputs and information that exist in the financial markets you will realise that attempting to understand precisely what causes a market to move in a certain way is near impossible. Therefore focusing on price brings benefits of simplification.
Not Just Technical Analysis
Trend followers claim that what they are doing is not just technical analysis. They point to the existence of trends across many spheres – economic, political, fashion, technological – to argue that trends exist across all areas.
It’s worthwhile to remember that trends are also tied to investor behaviour. For example, investor enthusiasm can drive stocks to extremes without any fundamental underpinning. This can ultimately make them susceptible to painful reversals but the trend follower learns to get out of the move before the market drops fully.
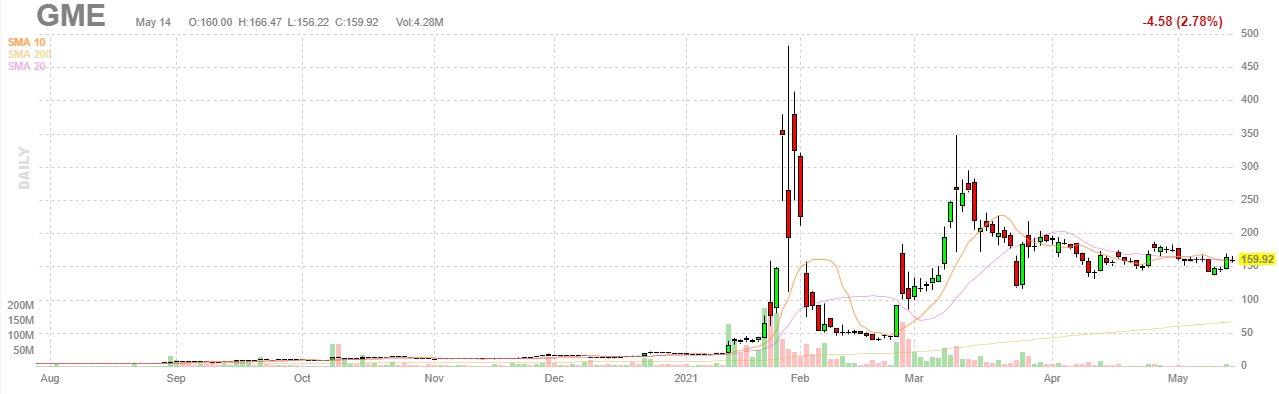
The dot com boom is a good example of irrational investors taking trends to extreme levels. But there are many more cases throughout history. They include the Dutch Tulip Mania in the 17th century, the South Sea Bubble in the 1800s, bitcoin and Gamestop.
Searching For The Long Tail
Back in 1909, Henry Ford made the statement that “Any customer can have a car painted any colour that he wants so long as it’s black.” This was in reference to the Model T, the car that made Ford a powerhouse in the automotive industry. This is a perfect example of mass marketing, which targets the vast majority of consumers with a very narrow product offering.
However, this principle is not the only way markets operate. Often, in business and in life, there is a long tail distribution. This is when a disproportionately high number of cases lie outside of the central peak of the distribution.
This distribution can be seen in many areas such as the success of companies like Amazon, which target the long tail with a huge array of products, rather than selling only a few products to a mass market.
In a long-tail distribution, less than 50% of cases fall into the core 20% of requirements, making chasing the long tail highly profitable for many businesses.
The same long-tail principle applies for investors who follow trends. Long tails are characteristic of financial markets. If you look at a broad selection of stock returns, you’ll find that some of them move relatively little over a year – maybe 10% or 15%.
There are a disproportionately high number of stocks that make much larger price moves – 10%, 200%, 500% or even more in some cases. These are the long-tail stocks that trend followers are hunting, since they offer the biggest opportunity for profits.
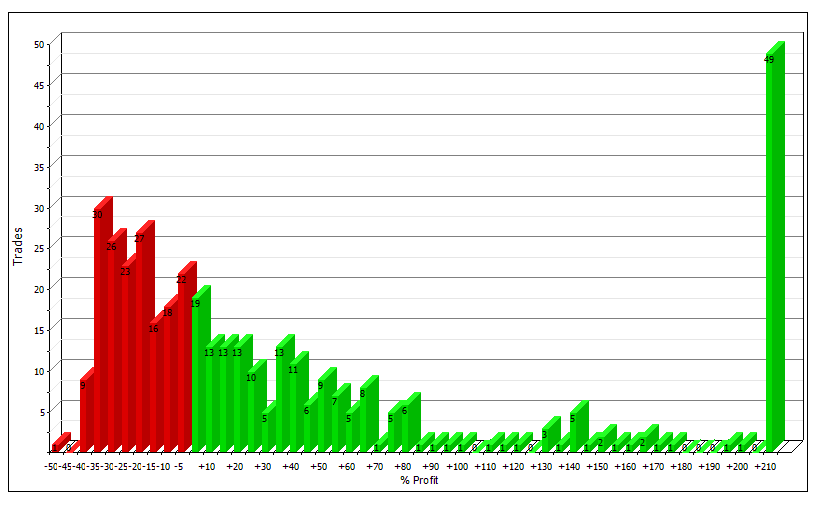
The following graphic shows a typical profit distribution for a trend following strategy on stocks. You can see that profits are highly skewed to the right hand side. This exemplifies the long tail of returns
Trend Following Strategy Basics
Because trend followers are trying to catch the long tail, they adopt a relatively straightforward strategy. They buy when the market is rising, and sell when it’s on its way down. They hope to get in at the start of a trend and get out when the trend is over. They don’t actually care what is driving the trend – they are unbiased and can make profits on both sides.
However, because not all trends will fit into the long-tail distribution, some will be short-lived and dissipate early. It’s a bit like waves at sea. There are tiny ripples, some bigger waves and the occasional monster. The big waves and the occasional monster are where trend followers make their profits.

However, to find the big waves, trend traders must also ride some of the smaller ripples. These ripples throw the trend traders off without any progress. Sometimes they find that the wave is moving in the wrong direction. They expect to be lifted up, but they find themselves falling off the other side.
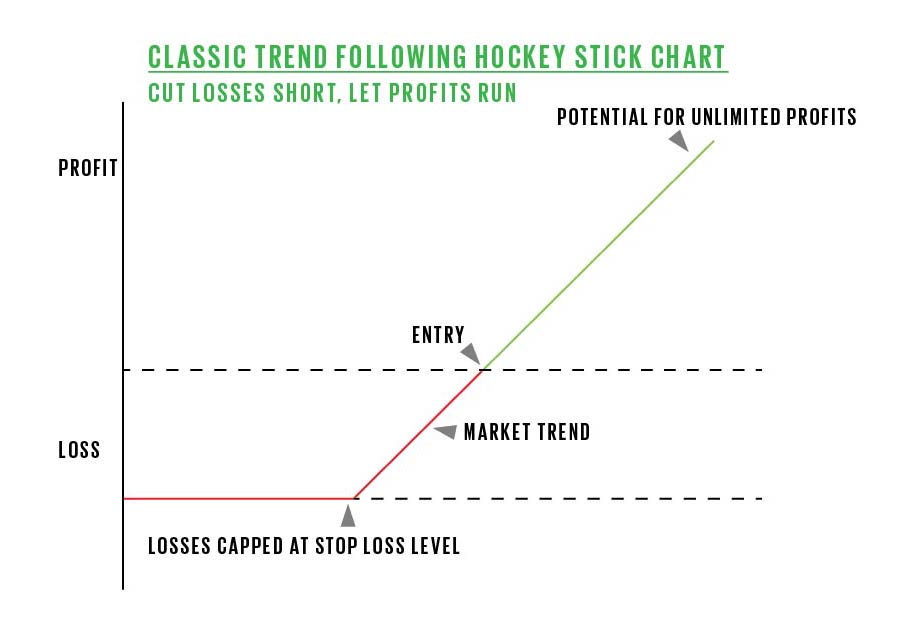
Trend followers not only need to jump on waves that look hopeful – in other words, a rising or falling stock – they also need to be prepared for when things go wrong. While they need to ride winners to their conclusion, they also need to get out quickly and cut their losses on losing trades. If they didn’t do this, the losses would overwhelm the wins.
In other words, the goal is to have a few big wins that more than offset a larger number of small losses.
In reference to the surfing terminology, trend following is about getting back on the board and waiting patiently until the big wave comes in and riding it into the shore. One big wave can make up for all the other smaller, missed waves.
How To Find A Trend
Traders who follow trends typically use technical indicators or mathmatical formulas rather than raw price charts.
They do this because formulas provide an objective way of establishing when a trend is underway. It is relatively straight forward to program such rules into a trend following trading system. Even so, some traders do rely on naked price data – known as price action – to find trends. This approach is less passive and requires more experience.
Following The Trend With Moving Averages
One of the most popular indicators for identifying trends is a moving average. This is basically the average of the price for the previous trading intervals. When a smaller number of intervals is used, this is known as a fast moving average, since the moving average line reacts quickly to changes in price.
When a larger number of intervals are used – a slow moving average – then this tends to change more slowly. The benefits of using a moving average are that it tends to eliminate any short-term fluctuations in the market, giving a less noisy view of the overall market direction.
Traders use moving averages to determine whether or not a trend is developing. They often use two moving averages together – a fast one and a slow one.
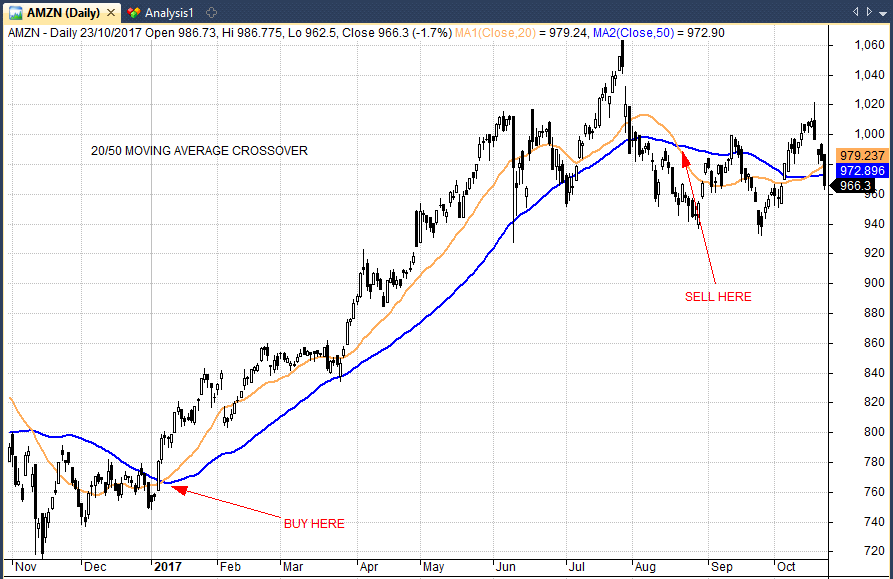
When the fast moving average crosses over the slow one, this is an indication that an upward trend is underway and is usually a strong buy signal. If the fast moving average then falls below the slow moving average, a downward trend is underway and the trend trader will sell.
The moving average crossover is the ultimate example of a simple trend following strategy. Here we see a clear example of a 20/50 day moving average crossover in Amazon:
In this article I investigate which moving average type actually works best.
Following The Trend With Breakouts
Another popular way of spotting a trend is to look for breakouts.
Here, the trader will look for a price to break out of its trading range and make a new high. For instance, if the stock has been trading between $2.20 and $2.30 for the last 50 days, and then rises to $2.35, this is a signal that an upward trend may be forming.
Different traders use different intervals. Generally speaking, longer breakout lengths (like the 52-week high) are more robust and less likely to result in whipsaw.
Most trend followers use trading programs to test which time intervals work best for finding profitable breakouts then work these into their trading systems. It’s worth remembering that every winning trend begins with a breakout.
A powerful trend can result in hundreds, even thousands of new highs.
Other Trend Following Styles
There are no rules that says a trend follower should stick to moving averages or breakouts. There are hundreds of other indicators that trend traders can use. Many traders use these indicators to get an extra edge, but the risk is that they make trading too complicated. Using too many rules can lead to overfitting and a trading strategy that works better in a backtest than real life.
Some of the most popular of these other indicators include Bollinger Bands and moving average convergence/divergence (MACD). Traders also MFI and the relative strength index (RSI), which measures how strongly the market is moving up or down.
These types of indicators can be used both to determine when the trend is strong – and likely to continue – as well as when the trend is too strong. In this case the market may become overbought or oversold. Buying a trend when the market is overbought doesn’t always work as it suggests that the trend is nearing its end.
Ultimately, it’s important to focus on the end goal, which is to capitalise on long term trends. Simple strategies often work better than complex models. Trend followers will often focus less on the entry rules and more on risk management and issue selection.
Managing Risk
As discussed previously, trend traders do not expect to make a profit on every trade. Generally, trend followers win around 30% – 40% of trades.
Because of this, it’s very important to limit the amount you lose on trades that don’t work out. This is the discipline of risk management.
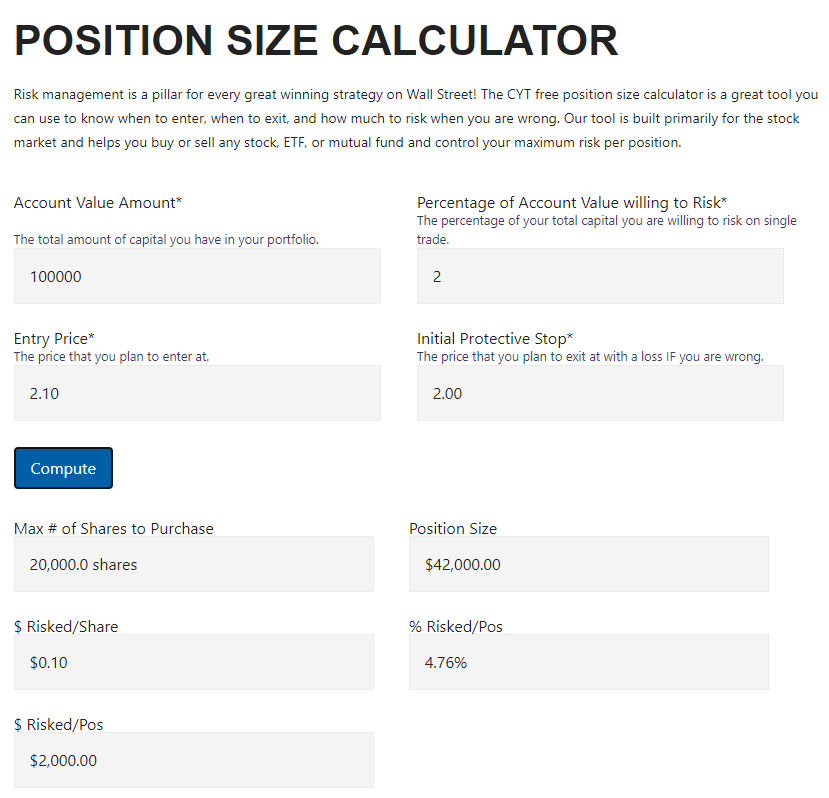
The first principle of risk management is not to risk a disproportionately large amount of your total capital. Some traders will limit their risk to less than 2% on any one trade – meaning, for example, that they will not risk more than $2000 if their total capital is $100,000.
That doesn’t mean that they only make a $2000 investment. It means they look at the maximum that they can lose on the trade, and then use this to establish how much to invest.
For example, you might buy a stock at $2.10, and then place a stop order which is triggered if the stock hits $2.00. You are expecting the stock to rise, but if it does fall, then the maximum you can lose is $0.10 per share.
This means that you afford to buy 20000 shares to risk $2000. In this case, your total investment is $42000 – which is significantly more than the $2000 you are risking. The only issue is if the market is illiquid enough that your stop loss doesn’t fill at $2.00.
Risk management can be used to size positions to an appropriate level for your trading strategy. Trend followers will backtest their strategies extensively to find out what a good level of risk is to take. They will also use position size calculators in order to get their trade sizes spot on.
Other systematic traders use different types of risk management. Some traders will use ATR or other indicators in order to size positions. The Kelly Formula provides the optimal position size when you have information such as win rate and expectancy.
A number of my own strategies use simple equal-weighted position sizing. For example, one of our trend strategies holds a maximum of 25 stocks at one time. Risk is weighted equally between each stock implying a position size of 4% per position.
Extensive backtesting has shown to me that equal weighted position sizing performs just as well, if not better, than more elaborate schemes. Since a trend follower has no idea which trends are going to be the most powerful, then it makes sense to weight stocks equally.
Stops Or Not
Some trend followers may use stop losses and some may not.
In the previous example, using a stop loss limits the downside of a potential losing trade and allows a trader to use maximum position size on their trade.
However, stop losses can be detrimental to a system if they are placed too close to the price action. It’s therefore worth doing some investigation into what kinds of stops work the best for the strategy being used.
Some trend traders avoid using stop losses. They instead manage risk by using small position sizes and diversifying across different markets.
Without doubt, the most popular type of stop loss for a trend follower is a trailing stop. In fact, some trend followers will use no other mechanism to exit trades.
A trailing stop is ideal for trend following since it cuts losing trades but allows trends to develop for long periods. A trailing stop is not going to exit a trade if a stock is still trending. For detailed analysis on trailing stops and which ones work, see this post Which Trailing Stop Is The Best.
Trend Following Strategy Risk:Reward
Trend followers like to measure risk:reward. They make sure that their strategy is providing an adequate return for the risk taken.
Since trend followers only win 30 or 40 percent of their trades they need to make sure that their winning trades cover their losses. That’s why trend followers like to see a risk:reward of two, three, or four times to one.
With a reward to risk ratio of 3 to 1, you can afford to lose 75% of your trades and still break even.
To establish what the potential profit is, trend traders analyze similar past historical trades, and will also look at other technical indicators to determine what the price movement is likely to be.
For example, the Average True Range indicator (ATR) measures volatility and provides clues about what sort of price range to expect.
However, the truth is that you cannot predict risk:reward with much accuracy. Since one winning trade has the potential to be a 10x or even 100x return, the most important thing is to keep losses small and stay alive until the big winner hits.
Only through extensive backtesting and forward trading will you get a clear idea of where your risk:reward ratio truly lies. Even then risk:reward can fluctuate over time and with changing market conditions. Once again, it’s important to trade conservatively in order to stay afloat during lean trading periods.
Trend Trading Systems
Trend traders tend to take a mathematical approach to trading, relying on indicators to decide which stocks to trade and when. Unlike fundamental traders, who tend to apply more individual judgment, trend traders tend to stick to the numbers.
We’ve already discussed one example of this – using moving average crossovers as a signal. In fact, one of the most common of these is when the 50-day moving average rises above the 200-day moving average, crossing it from beneath – this is known as a golden cross.
Similarly, when the opposite cross happens – the 50-day average falls below the 200-day one – this is known as a death cross. One system could be to buy when a golden cross occurs, and sell when a death cross shows up.
Because this is a very well defined strategy, it is easy to go back and see if the strategy would have generated profits using historical data. The trend trader can then discard any strategies that obviously don’t work, and then optimize the ones that do by changing the parameters – for example, using periods other than 50 and 200 for the two moving averages.
Of course, this is a very simple example of a trading system – and because of it’s notoriety it’s unlikely that it will produce staggering returns anymore.
Trend following strategies can range in complexity but many are relatively easy to automate using computerized trading systems. This not only reduces the amount of manual work that the trader needs to do, it also takes a lot of the emotion out of the equation – which is important, since emotions often lead to trading mistakes.
Even if they are able to completely automate their trading, however, trend traders shouldn’t make their systems too complex. First of all, this means that they could fail in unexpected ways – more complexity makes systems more unpredictable.
At the same time, there is the risk that they develop a system that fits all the historical data perfectly – just because it has been tuned to do that – but really has no validity when it comes to anticipating future market behavior.
Curve Fitting And Other Biases
Trading systems that work well on past data do not always work well on future data. Curve-fitting a system to past data is just one of a number of biases that a trader needs to overcome in order to develop a system that is robust and ready to use on real markets.
Selection bias dictates that a trading system’s performance could just be by chance, while survivorship bias can impact on a system by not taking into account securities that have since fallen off of the exchange.
Traders need to understand the principles of sound trading system design in order to create a system that will not fail on live markets. Since there is no quicker way to the poor house than by following a badly designed trading system
Diversified Trend Following
Most trend following funds are run by CTA’s (commodity trading advisors) and they typically trade a diversified basket of different futures. Commodities such as gold, wheat, crude oil, bonds such as US Treasuries, currencies and stock indices.
Many trend following funds trade around 60 different futures markets and they use correlation matrixes to spread their risk over different types of markets. The following graphic shows how trend following or managed futures funds might diversify their portfolios:
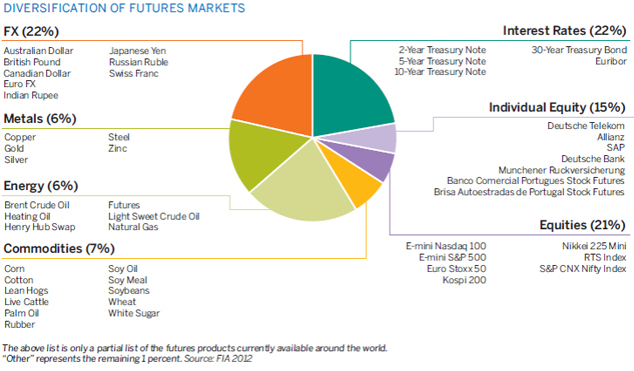
This is a key component of trend following futures that allows trend following funds to find trends in all types of market conditions.
Does Trend Following Work On Stocks?
Before we go much further it’s worth demystifying a couple of things about successful trend following on stocks.
Firstly, there are very few trend following funds in the world that trade stocks alone and the reason for this is that a core element of successful trend following is the diversification that we looked at above.
Individual stocks are very closely correlated; they tend to all move up together and all move down together therefore trend following on stocks needs to be done slightly differently.
A trend following strategy can perform well on individual stocks so long as it’s tailored sufficiently.
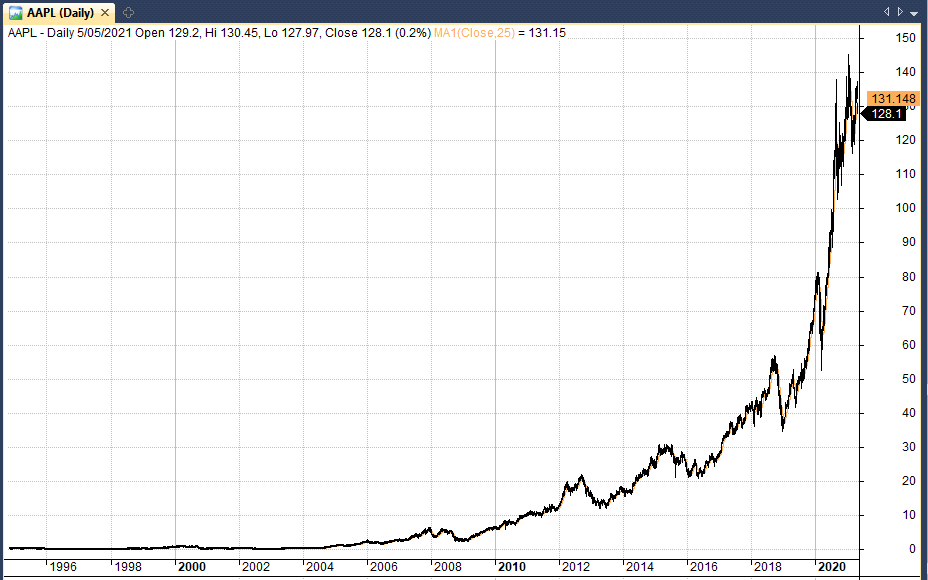
One of the first things to bear in mind is that shorting stocks in a trend following strategy needs to be done very carefully. Historical testing shows that shorting stocks is not very effective in trend following models since stocks have an inherent upward bias.
Unlike a currency pair which is unbiased to either direction, most stocks are productive assets that move higher over time according to earnings and inflation.
As a result, diversification when trend following individual stocks is harder to come by. This means that a trend following approach on stocks can not be expected to perform at it’s maximum during all market conditions.
During bear markets, a long-only trend following stock portfolio will find it near impossible to make money.
Identifying Market Regimes
A potential solution to the lack of diversification in a trend following strategy for stocks is to use a market regime or market timing filter.
The idea is to find a way to switch out of stocks when the overall market is entering a bear stage. When the broader market experiences weakness, trend following funds can move out of stocks and into cash, or bonds. Alternatively, trend followers can switch to shorting stocks when the regime has changed to a bear market.
A common example of a market regime filter is to exit a trend following strategy when the S&P 500 is under its 200-day moving average. This environment is often not conducive to long-only equity strategies. However, there are many other ways a trader might try to identify market regimes such as with economic data.
It’s important that any market regime filter is tested carefully so as not to introduce over complication or curve fitting. Shorting stocks is tricky even with perfect timing, so systems need to be robust.
Overall, the evidence suggests that trend following works on stocks for the same reason it works on other markets; it enables the capture of long tail returns, the stocks that go up and up.
Trend Following Strategy Example
The following equity curve shows the historical performance of a simple trend following strategy that we developed and applied to US stocks.
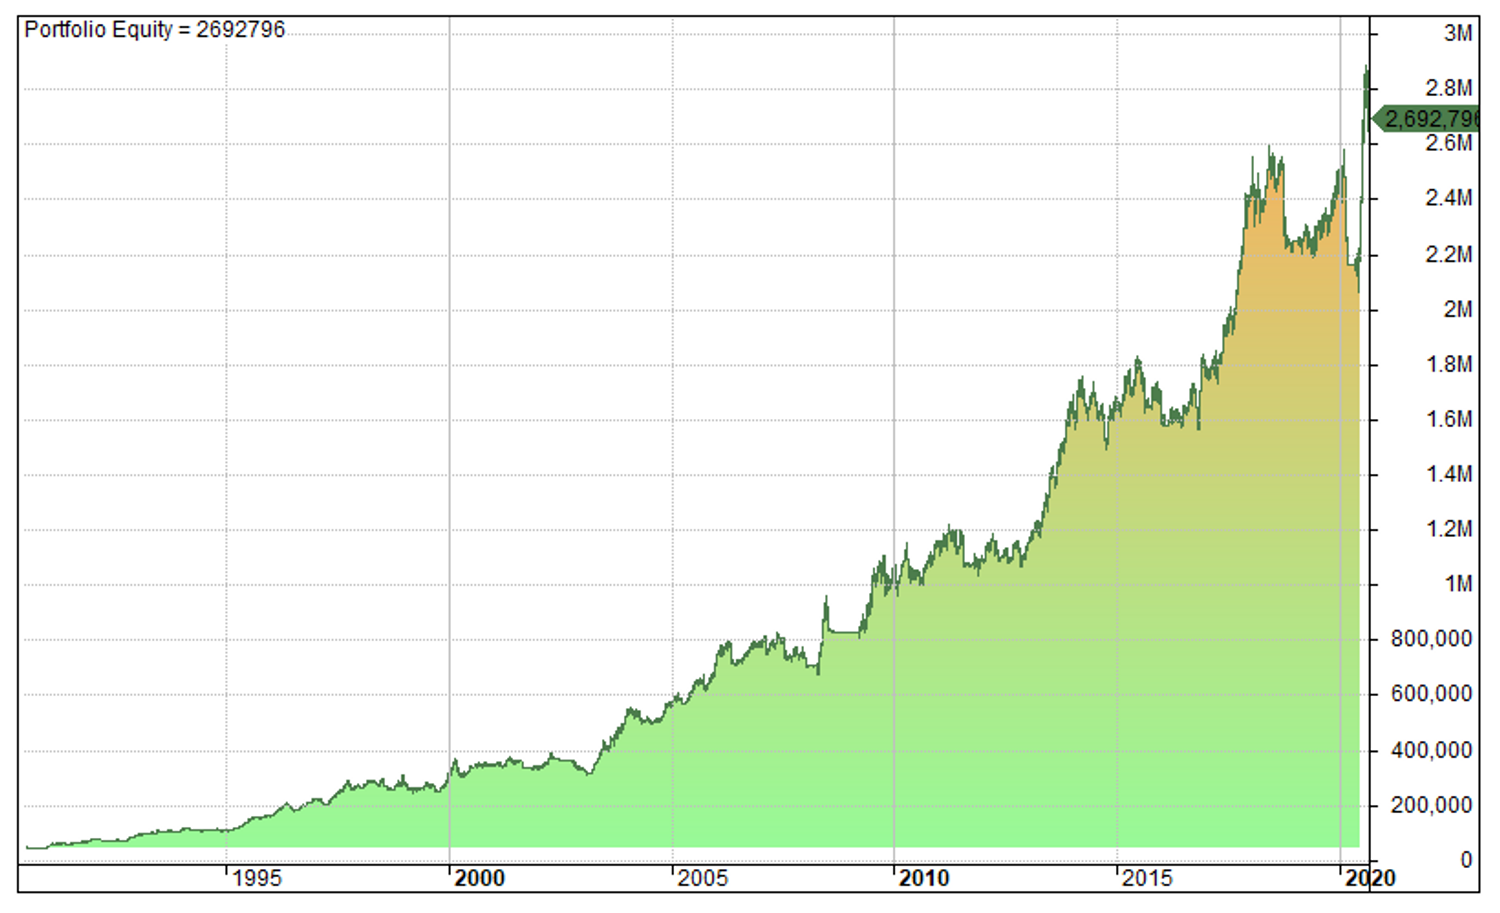
This simple trend following system holds 25 stocks at a time and buys a stock whenever it makes a new 252-day high. It also incorporates a market regime filter which allows it to take new positions only when the S&P 500 is above it’s 90-day moving average.
During the test this system produced a 14.16% annualised return with a maximum drawdown of -20%. This is significantly better than the buy and hold return on the S&P 500 which was 9.01% with a drawdown of -55%.
This system uses the same equal weighting position sizing that I mentioned above. It is tested on survivorship-bias free data and includes transaction costs and dividends. We have many similar trend following strategies on our research program.
Is A Trend Following Strategy Right For You?
It’s worth mentioning that a trend following strategy is not for everyone. If you like high win rates and you like to be right a lot of the time then following a trend strategy might be difficult for you.
For example, a trend following strategy might incur 20 losing trades in a row. Some investors are unable to deal with that. They will bail from the system after a series of losses which turns out to be the worst time to stop trading the system.
Similarly, trend following requires a detachment from the market and a passive mindset. A trend follower becomes more like a robot, simply following the trades as directed by the computer.
Some times a trend following strategy can stay in a drawdown for a long time, perhaps 12 months or more. Trend following is not the strategy for you if you require active involvement and working out the ‘pieces of the puzzle’.
Famous Trend Followers
One of the most well known trend followers is Jesse Livermore, a trader from the Great Depression era who was immortalised in the classic trading book ‘Reminiscences of a Stock Operator’. Livermore made and lost many fortunes during his career and his writings are still the cornerstone of modern trend following strategies.
Nicholas Darvas was another trend follower who made it big in the markets, turning $25,000 into $2,000,000 in just a couple of years during the 1950’s.
Darvas’ approach was based on boxes. He would draw boxes around the recent price action and when a stock broke out of the box he would buy it and ride the trend higher. When the stock fell back into the box he would sell and he would always prefer the strongest momentum stocks.
The late Richard Donchian was another trend following pioneer who was around from the 1960’s and Donchian also began the process of computerised trading which inspired fellow trend follower Ed Seykota.
Other famous trend followers include Richard Dennis and the Turtle Traders who were profiled in the original Market Wizards book by Jack Schwager. Dennis made many millions trading a simple breakout strategy in the commodities markets and taught the strategy to a bunch of students who had no experience in the markets, who ultimately also made millions of dollars.
William Eckhardt was Dennis’ partner at the time, and Eckhardt still operates his flagship trend following fund today. It’s been going since 1980’s and has over $300 million assets under management.
Other high profile trend following funds that are in operation today include Bill Dunn’s Dunn Capital which returned over 50% in 2008, Michael Clarke’s Clarke Capital (founded in 1993) and David Harding’s Winton Capital which holds over $24 billion in assets.
Following is a larger list of high profile trend following funds and best trend following traders that exist today:
- Abraham Trading founded by Salem Abraham.
- Altis Partners.
- Beach Horizon founded by David Beach.
- BlueTrend, from BlueCrest Capital.
- Campbell & Company.
- Chesapeake Capital founded by Jerry Parker.
- Clarke Capital founded by Michael Clarke.
- Covenant Capital.
- Drury Capital Inc.
- Dunn Capital founded by Bill Dunn.
- Eckhardt Trading.
- EMC Capital founded by Liz Cheval.
- Hawksbill Capital.
- Millburn Ridgefield.
- Mulvaney Capital Management.
- Sunrise Capital.
- Transtrend.
- Winton Capital.
What Happened In 2008?
As mentioned above, trend followers cleaned up in 2008 as stock markets imploded and huge price moves were seen across many different markets.
One incorrect assumption is that trend followers made all that money in 2008 shorting stocks but that isn’t the case at all. Trend followers rarely short individual equities and a lot of the money made by trend followers was in other areas.
In particular, trend followers made big money from US Treasuries and bonds which soared during the financial crisis. They were also able to capture big gains in crude oil, on the long side and on the short side when the commodity reversed.
Many also did well in other commodity markets; pork bellies, sugar and gold. And there were big profits to be made in currency pairs such as GBP/USD and USD/JPY.
As mentioned earlier, a crucial part of successful trend following is diversification and in 2008, we saw many uncorrelated markets post big trends in different directions. These were near perfect conditions for trend following.
Does Trend Following Still Work?
Since 2008, the performance of trend following has been sporadic causing some to claim that the strategy no longer works. 2014 was a good year but apart from that performance has been declining.
The chart below from the Financial Times clearly shows how trend following funds have struggled recently:
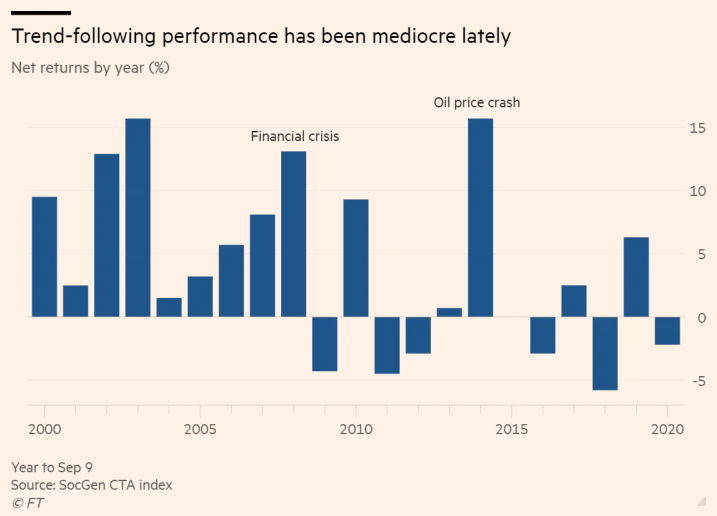
What’s interesting is that many of the trend following gurus that make a living teaching trend following rarely refer to this declining performance. Instead they continue to focus on the returns of the 1980s, 1990s and 2000s.
But the years either side of 2014 have not been kind and most trend traders have found it hard to match the impressive returns that were seen in the past.
The table of results below, for example, shows just how trend following performance has degraded since that time. Performance in the 1990s was regularly in the 20% to 30% range but now it is much lower:
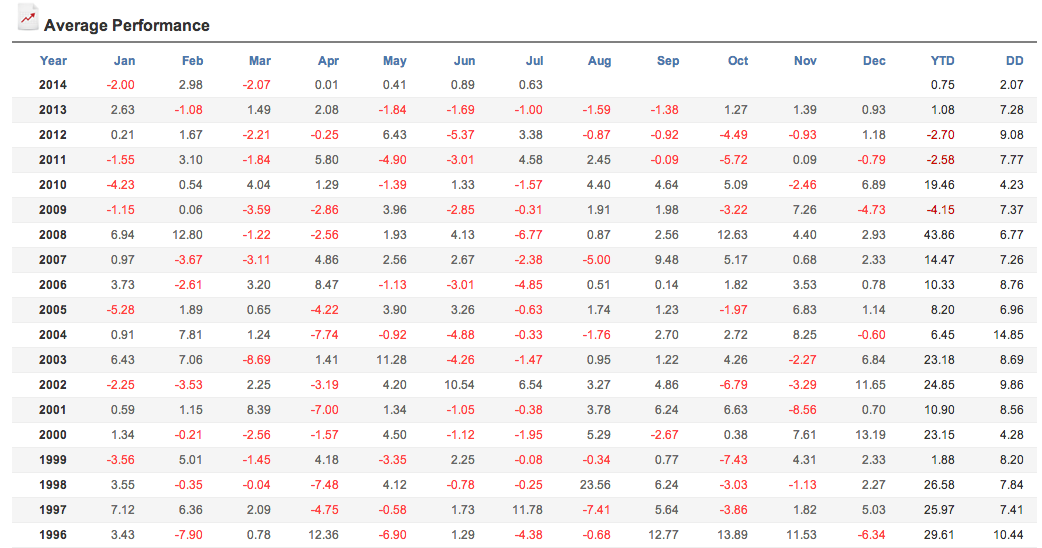
Of course, these results do only represent one segment of the trend following industry; that of managed futures or CTAs. These results don’t include any of the smaller trend following funds, private traders or equity traders.
In recent times, we have seen heavy central bank intervention, low inflation and record low interest rates. These conditions have not provided too many trends in commodity or currency markets which is why many CTA trend following firms have struggled. However, we have seen strong trends in equity markets which is why trend-focussed equity funds have done better.
What Do Trend Followers Think About The Future?
Winton Capital, one of the largest trend following funds, released a paper arguing that although trend following is not dead, there has been evidence of a degradation in performance. Winton said:
“We find trend following systems to be effective in forecasting future price movements, but we observe a significant and persistent decline in the forecasting ability of those with the fastest turnover.”
Winton Capital. Historical Performance Of Trend Following, December 2013.
Winton Capital also had a poor 2020 in their flagship trend following fund. It’s also worth noting the closure of several trend following funds such as that of John W Henry, who is also owner of the Boston Red Sox.
Some trend followers lay the blame at the Federal Reserve, claiming that the excess of liquidity has created an artificial, low interest rate environment that has seen normal trends hard to come by.
Conclusion
Price trends have always been a key feature of financial markets. In some cases, they are linked to external events, but in many cases they are driven by technical factors or by the sentiment of market participants.
Trend following performance has degraded in recent years but many trend following strategies still work and many trend traders are still successful. Human emotions play a part in financial markets and can cause markets to move in interesting ways. This was emphasised by the recent developments in GameStop and bitcoin.
Traders who understand this and can identify new trends have the potential to generate large profits.
However, anyone who is considering getting into trend trading has to understand that they are not going to win all of the time. They need to take a scientific approach to trend trading that eliminates any emotional involvement. Successful trend followers are robotic, they execute their strategies and do not take thrill in victory or agony in defeat.
A trend following strategy offers a robust entrace to financial trading and is a worthwhile addition to any traders toolbox.
Notes: Trading system charts from Amibroker using historical data from Norgate.
the ability to “forecast” with trend following has been impacted by the lack of genuine diversification amongst asset classes. The cross-market correlation has been too high since 2008 hence one of the benefits of TF, diversification, has failed to work courtesy of QE.
Very good point, thanks for your input.
“holds 25 stocks at a time”. If there are hundreds of stocks that qualify in the entry criteria, how do you pick which are the best 25?
It uses a ranking score based on RSI momentum indicator. So if there are more than 25 stocks it picks the ones with the higest RSI score.
Thanks, but this is how my own analysis looks: https://imgur.com/a/dgTpRQf
The percentage returns of the trades are on vertical (y) axis and 14 day RSI prior to trade entry is on the horizontal (x) axis. So I’m not seeing evidence that higher RSI is “better”. At best we have a “RSI sweet spot” that is very wide.
What are your thoughts? How did you come to this “highest RSI” conclusion?
Sidenote: Just noticed that in my chart, the percentage return is max 100% which might be confusing. The reason is simply that I was filtering out trades that are longer than 100 days.
This doesn’t affect my original question about what makes higher RSI “better”.
I didn’t say it was better. I needed a ranking method so I chose RSI. I figured higher values would be more consistent with the trend following nature of the system.
Thanks for the clarification 🙂 I’d now say, given how well your trend following system works **despite** the somewhat casually chosen RSI ranking is a testament to how good the trend following system really is. Would you agree? Thanks!
Thanks. Yes I think it’s a simple but decent system. But then trend following has historically been a good choice and the last few years have been fairly smooth sailing.
Thank you for your concise, yet deep and thorough assessment of trend-following(TF). I have struggled with TF, over the last few years. You have given me some insight and relief that under performance wasn’t just my fault alone. Like I believed.