
A trailing stop is a stop loss order that moves with the stock price. As the stock price rises, the stop moves higher too, locking in profit and reducing the risk of a loss.
For example, suppose you buy Apple at $100 and enter a $20 trailing stop. When Apple moves to $120, your stop moves to break even. When Apple moves to $150, your trailing stop moves to $130 locking in $30 of profit.
A trailing stop can also be applied to a short position. Here, the stop will move lower as the price falls. Crucially, the stop loss only moves in the direction of the trend, never back. This means the only risk of losing more than the trailing stop amount comes from slippage or an overnight gap.
The key difference between a stop loss and a trailing stop is that a stop loss will stay fixed in a position so you know what your maximum loss will be. A trailing stop moves in the direction of a trend, locking in profits and reducing risk.
The Key To A Good Trailing Stop
The key to a good trailing stop is that it needs to be loose enough so that the stock has room to trend upwards. But it cannot be too loose or you will give back too much profit when the trend changes.
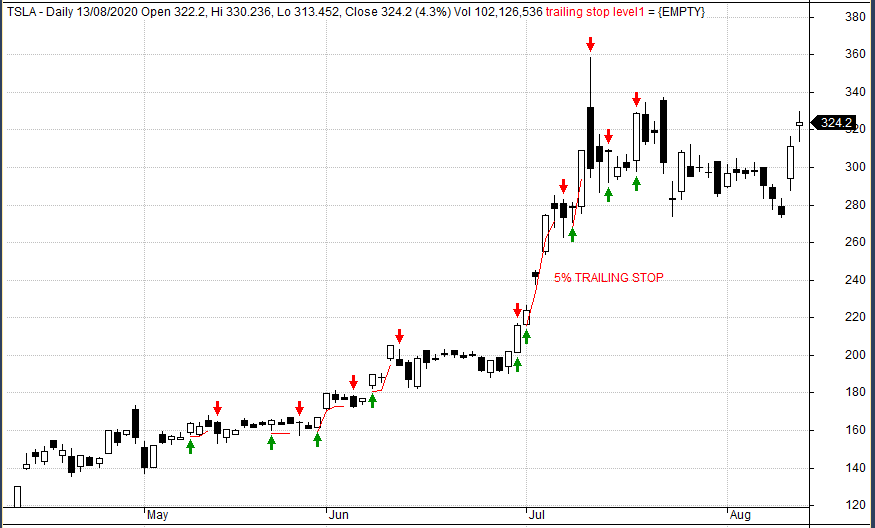
For example, in the Tesla example below, you can see that the 5% trailing stop is too tight. It doesn’t allow the trend to develop and we take too many trades instead of following the trend:
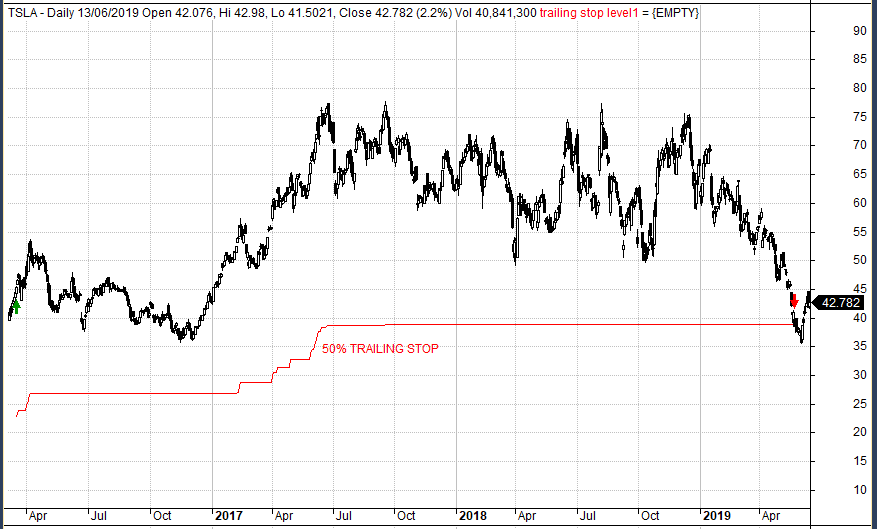
Conversely, the 50% stop loss price is too loose. We don’t capture enough of the trend and end up taking a loss when we could have had a decent gain:
The best trailing stop percentage strikes a balance between the two. You want it to be loose enough to allow the trend to develop but you don’t want to give back too much profit in a change of trend.
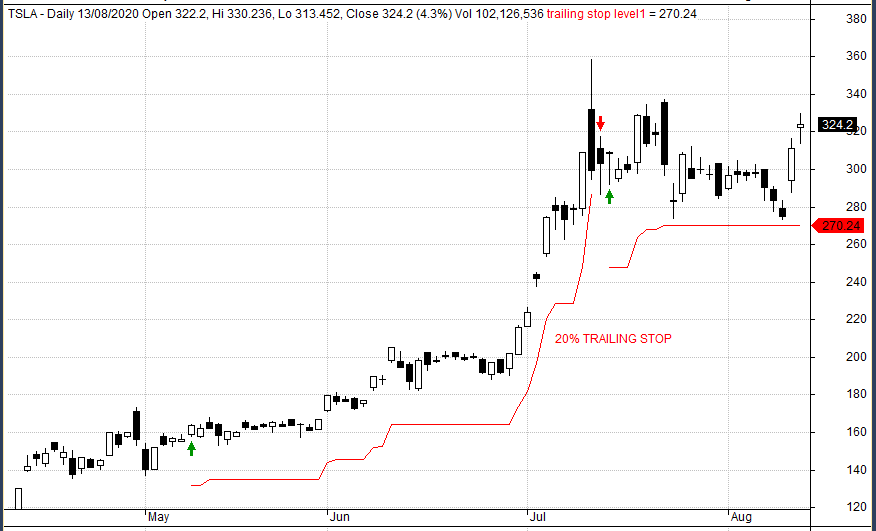
Ultimately, it depends on the situation and the stock you are trading. But I’ve found that the 20% trailing stop (below) often does a good job:
What Is A Good Percentage For A Trailing Stop?
To find out which trailing stop percentage is the best I’m going to do a study on historical data. This data will cover 11,000 US stocks over 30 years. I will look at the results of attaching a trailing stop order following a new 252-day high.
After this, I will move on and test some other types of trailing stop orders like ATR (chandelier stop), moving average stop and Parabolis SAR.
The following table shows the performance of different percentage stops in the Russell 3000 stock universe between 7/1990 to 1/2020:
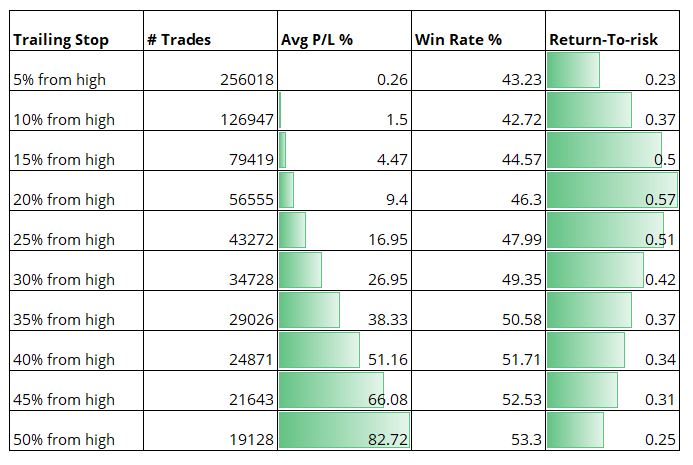
As you can see from the table, the 5% trailing stop produced a huge number of trades (256,018) and an average profit per trade of 0.26%. The 5% stop results in too many trades and not enough profit potential.
Meanwhile, the 50% trailing stop produces the lowest number of trades (19,128) and the highest profit potential of 82.72% per trade. However, the return-to-risk score (annualised profit divided by the maximum drawdown) is the second lowest at 0.25. In other words, the 50% stop is too loose. It captures some big winners but it also give back a lot of profit leading to increased volatility and a choppy equity curve.
The best trailing stop percentage sits between 15% and 25%. This range consistently shows the best retrurn-to-risk while maintaining a reasonable profit per trade and win rate. Based on this analysis, a trailing stop between 15% to 25% would produce the most stable equity curve growth.
Chandelier Exit
The Chandelier Exit uses the average true range indicator (ATR) to fix the stop loss a certain number of points away from the stock price. ATR measures volatility so this is another popular type of trailing stop among trend traders.
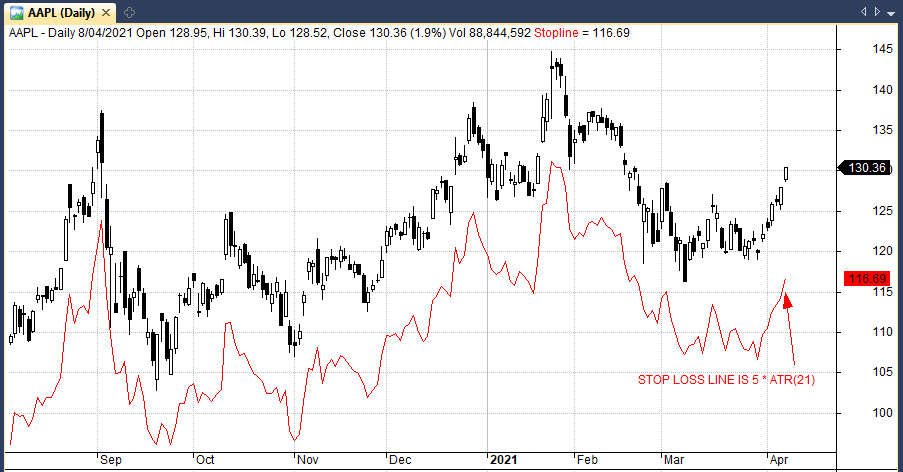
The advantage of this technique is that it takes into account the volatility of the stock and places the stop a certain multiplier away. For example, if Apple is trading at $100 and we use a 5 times ATR(21) stop, the stop will be placed 5 times the ATR(21) below the recent high. If ATR(21) is $5, then the stop will be fixed at $75 ($25 from the high).
ATR stop calculation:
- Apple High Price: $100
- ATR(21): $5
- Multiplier: 5
- Stop Loss Amount: $25 (5 x $5)
- Stop Placement: $75 ($25 from the high)
As the stock moves up, the ATR stop moves higher with it. Much the same way as the percent trailing stop. The ATR value can either be fixed at the start of the trade or variable. If variable, then the ATR value changes every day to reflect the changes in volatility of the stock. If fixed, then you use the ATR value from the bar that the trade was entered and do not adjust it.
Test Results
The following table shows the performance of an ATR(21) trailing stop with different multipliers from zero to 15. Once again, we are testing new 252-day highs on 11,000 US stocks between 7/1990 – 1/2020:
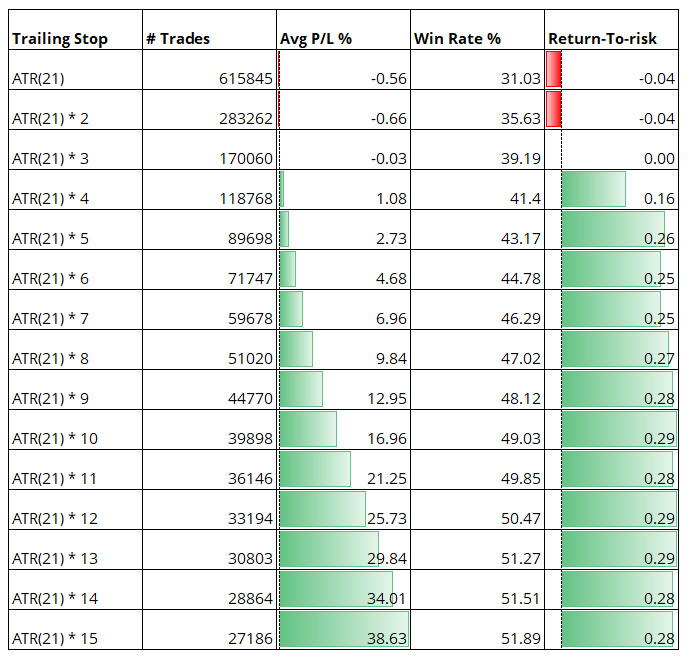
The table above shows that a simple ATR(21) trailing stop is too tight and leads to significant losses. A stop placed at ATR(21) points away shows a negative return-to-risk and an average profit per trade of -0.56%. It is a similar story for ATR(21) times two and three.
You can see that the results for the Chandelier stop improve using a multiplier of five or more. In fact, the return-to-risk scores are remarkably consistent from five times ATR to 15 times ATR.
However, the highest return-to-risk score of 0.29 is roughly half the highest score that we got in the percent test. In other words, the percentage trailing stop outperforms the Chandelier exit in almost every case.
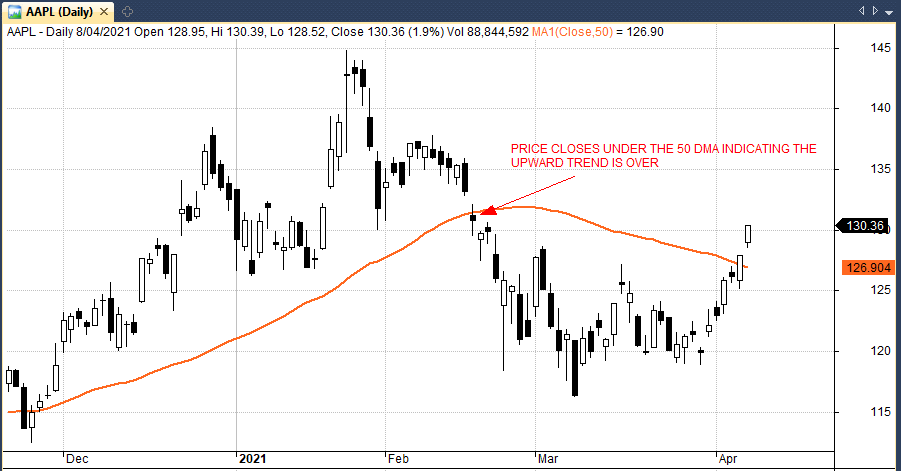
Moving Average Trailing Stop
A moving average trailing stop works as follows. Once we enter a trade (new 252-day high) we will follow the stock with a simple moving average line. If the trend changes and the stock drops under the moving average line we will then exit the trade on the next day open.
The following table shows the performance from exiting trades using different moving average lengths. For example, exiting a trade after the price crosses under the 10-day MA or 100-day MA. We used the same data and settings as in previous tests:
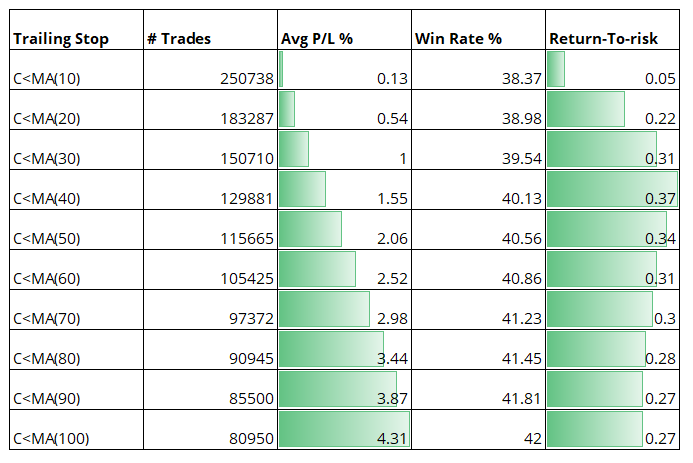
You can see from this table that the 10-day moving average does not provide a very good result. The average profit per trade of 0.13% would likely not be worthwhile for most traders.
The moving average trailing stops produced a reasonable return-to-risk score in the 40-60 day range. For example, a close under the 40-day MA resulted in an average profit per trade of 1.55% and a return-to-risk score of 0.37. This measured as annualised return divided by maximum drawdown.
However, once again, the results are not as good as those we recorded in the percentage study.
Parabolic SAR Trailing Stop
The parabolic stop and reverse indicator (PSAR) rises according to parameters dictated by the Parabolic SAR formula. The key difference is that unlike the usual trailing stops, PSAR continues to move higher even as the stock stays where it is or declines.
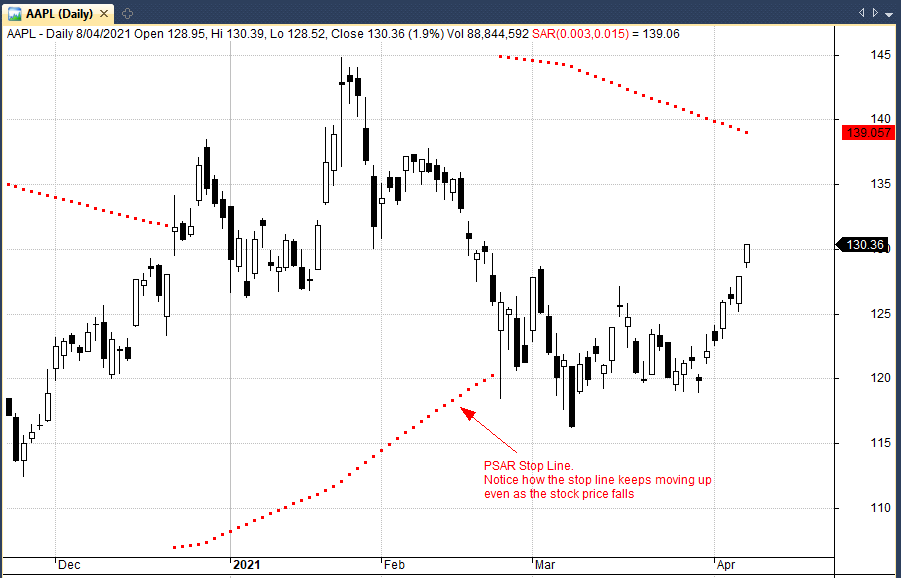
With a 20% trailing stop order, the stop loss stays 20% from the high even as the stock drops. But with a PSAR stop, the stop loss will move higher even as the stock falls.
This means there’s an element of time involved. Essentially, the stock is penalized for not continuing the trend upwards. If the stock does not keep trending higher, the parabolic SAR will exit the trade.
The PSAR indicator is made up of two parameters, acceleration factor and max acceleration. These are usually set up as 0.02 and 0.2. However, I found these default parameters to be too fast resulting in many whipsaw trades. I decided to test several varations to see which works best.
The following table shows the performance of the PSAR trailing stop with different settings of acceleration factor and max acceleration:
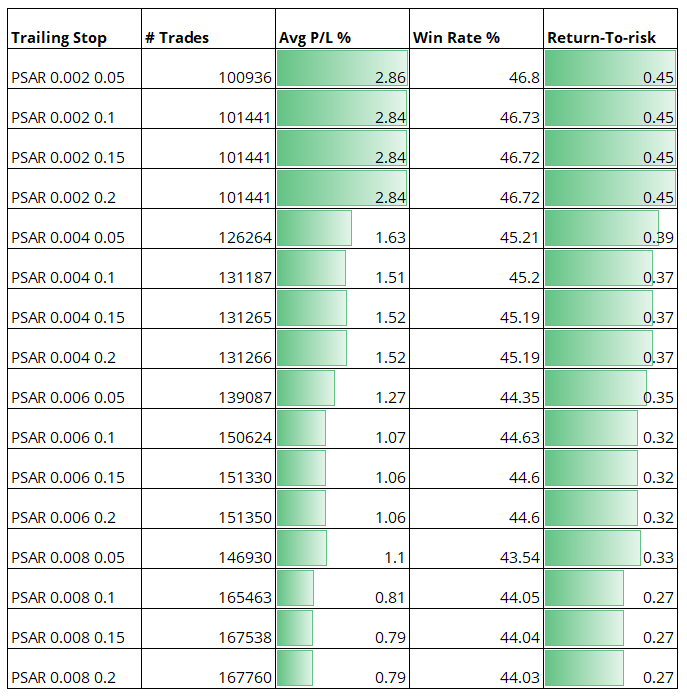
You can see from the table that the Parabolic SAR indicator produced some pretty good return-to-risk scores. This is particularly true for the very small parameters such as 0.002, 0.05. This is interesting because the parameters are much smaller than most guidebooks recommend.
The lowest setting (acceleration factor: 0.002, max acceleration: 0.05) produced an average profit per trade of 2.86% with a return-to-risk score of 0.45 and a win rate of 46.8%.
Which Trailing Stop Works Best?
The results shown above provide some answers as to which trailing stop works best when trading stocks.
- The best trailing stop by return-to-risk was the 20% trailing stop with a score of 0.57. This was followed by the 25% stop (0.51) and the 15% stop (0.50).
- The best trailing stop according to average profit per trade was the 50% trailing stop with an average profit of 82.72%.
- The 50% trailing stop order also had the highest win rate at 53.3%. However, the 50% trailing stop naturally has a high drawdown indicated by the lower return-to-risk score. It also has the longest trade duration which would lead to slower equity growth.
- The Chandelier stop did not perform particularly well with low return-to-risk scores across the board. This is despite the indicator being a popular exit technique among trend traders.
- The moving average stop was not particularly effective either and clearly needs some improvement.
- The Parabolic SAR indicator put in some decent scores according to return-to-risk.
- Overall, the 15%, 20%, 25% and Parabolic SAR trailing stops appear to work the best.
Cautions To Be Aware Of
The trailing stop is a very useful exit. It simplifies the process of letting winners run but keeping losses small. This is why they are very popular among traders and in guidebooks. However, there are some cautions to be aware of as well.
Poor Behaviour
The first comes from poor behaviour of the stop order itself. This is not often talked about but I’ve found that stop orders in the market can sometimes do funny things. It’s rare but occassionaly I’ve had my stop orders cancelled for no apparent reason. When you use any type of stop with a broker keep an eye on it to make sure it is doing as you expect.
Execution
Another issue comes from execution. A very tight trailing stop can enter too many trades and rack up high transaction costs. This is particularly true in less liquid stocks where bid:ask spreads are wide and volatility is higher. You need to make sure to use a trailing stop in the right situation. A small, less liquid stock is not usually a good candidate. These stocks can drop quickly and stop you out on minimal news before moving right back.
Overnight Gaps
One of the issues when trading stocks is that exchanges are not open 24 hours. This means any stop orders that you place in the market will not be relevant overnight. For example, if you have a 20% trailing stop in the market but the stock opens down 50%, it’s likely that you will take a 50% loss on the trade instead of the 20% loss that you had planned. This is another reason why trailing stops need to be considered carefully and are not always good for volatile companies.
Backtesting Bias
Lastly, although I have shown some results on this page using a large sample of data, it’s useful to remember the limitations of running backtests. The past cannot predict the future completely so trailing stops that worked well in the past may not necessarily work as well going forward.
Conclusion
In this article we looked at various types of trailing stops and tested them on 11,000 US stocks back to July 1990.
We found that the percentage trailing stop (particularly the 20% and 25%) does a decent job of capturing upward trends in stocks while limiting risk.
Meanwhile, the Chandelier stop and moving average line produced disappointing results and do not provide much reason to use these methods.
These findings support my previous experience and it was no surprise to me that the percentage stop losses performed strongly. I have often used the 20% trailing stop in my trading and used it in many trading strategies.
If there is a surprise in these results, it is the decent scores for the Parabolic SAR indicator.
The PSAR indicator looks like it has some merit and I intend to test it with my existing trading strategies to see if it improves performance.
Notes
Article updated: 10 April 2021. The data used for this analysis comes from Norgate Data and includes historical constituents and delisted stocks so as to minimize survivorship-bias. Data also includes dividends, is adjusted for splits and corporate actions and includes transaction costs of 0.1% per trade. Risk-to-return is defined as the annualised return divided by maximum drawdown. Stock charts created in Amibroker.
Thx JB, good analysis!. I use a special kind of SAR for my strategies and works fine.
What about backtesting it with another kind of entry, like a simple Golden Cross, or maybe testing on a intraday basis, 1H, 4H or just Indexes wich movement is more peaceful than stocks?. You think results will also be similar?
Best,
I wouldn’t like to speculate but I will certainly test it on my existing stock and ETF systems to see what the results are like. Can you elaborate any more on your special SAR? Cheers.
Sure!, It´s a SAR stop about their movement with the price, BUT the Stop distance at the start of the trade is defined and backtested with a Chandelier range.
Easy, nothing more.
Ok.
Joe You are a very humble n superb person Sharing knowledge generously is the biggest thing one can have
Thank you.
Excellent article, I have only used fixed numbers as trailing stops and just back tested to see what numbers get the best results. I will definitely try the 20% TS
Great!
Hi Joe,
so you’re out of each trade only by being stopped out, no take profit, right ?
That’s right.
Is there a way to show this on a chart like in Think or swim platform ?
Thanks
Great article! Have you done custom software for that or is it available somewhere as opensource for more analyzes? I wonder how % trail stop will look like for specific segment and limiting time (e.g. technology segment only while avoiding dot-com bubble… e.g. 2005-2020). So far I rather set trailing stop for each stock differently (checking historic trend) and usually I end up with ~10%. Also wonder what is the right stop for high volatility stocks (e.g. SPAQs).. there 30% or maybe even more might more suitable.
Thanx so much for sharing your data. I have a question, and maybe it was right in front of me but I missed it. You clearly define the criteria for exits in each test. I don’t however see how you chose to re-enter the stock. Did you wait for a new 252 day high to re-enter the position after it was sold?
Yes, that is correct. Thanks.
Thanks for this article! Great info.
Thank you Joe. It cleared up alot.
Many thanks.
Based on the 20% stop, there were 56,555 trades at an avg profit of 9%. This would equate to a 5,090% return on avg position size. So, assuming one put $1,000 in per trade, it would have equated to +$50,900 over that timespan. Is that correct?
$90 profit per trade x 56,555 trades is $5.09m
Hi Joe, The ATR stop should not drop from it’s high right? The ATR on your chart is moving constantly with price not doing it’s job as a stop. It should basically ratchet up as price moves up but not drop as price retraces. I would expect ATR stop to have similar performance to % method.
You’re correct, that chart is not accurate I will remove it.
I don’t see the ATR Ratcheting stop; just the one in Chandelier exit. Woule be very interested in results for ATR which only goes in one direction.
Regards
Hi, can you clarify the risk/return ratio, in particular units/values? These all seem to be <1, but the average returns seem to indicate positive trends.
return to risk is the annualized return of the signal divided by the maximum drawdown. So a signal that achieves an annualized return of 25% with a maximum drawdown of 50% would have a score of 0.5.
Hi! I have a question… there is a simple version of traling stops that works just like a “trailing gap”?… with this I mean if I set the trailing stop 40 pips below market price, it will follow up the trend until it comes back, kept in the last price it were draged by the trend, but for moving again it will wait until the 40 pips gap have been achieved again.
My idea is to solve the traditional closing of trailing stops that get always draged into the price curve with successive up and downs. I hope you understood what I have tried to explain.
Thanks beforhand.