
Momentum investing is a successful method practiced by many investors around the world. In the past, authors have mainly focused on price momentum with a lookback period of around 12 months.
More recently, authors have been including fundamental factors into their analysis. Factors such as earnings, revenue and profit margins. For example, this paper called Twin Momentum.
In this article, we will look at four separate measures of momentum; price momentum, revenue momentum, net income momentum and EBITDA margin momentum. We will then be able to see which measures produce the best returns for investors.
Momentum Investing Strategy Rules
We start with a database of 8,000 US stocks from Sharadar that includes fundamentals and delisted symbols. We avoid nano caps, micro cap stocks and ADRs.
We then isolate our four factors (price momentum, revenue, net income and EBITDA margin) and normalise them so that they can be scored from 0-100.
Next we build the backtest. Starting in 2001, each year we will buy the top 25 stocks from our database that have the highest score for each of the four factors mentioned above. Positions are then held for another year.
We start with $50,000 base capital, use commissions of $0.005 per share and an equal weighting position size of 4% per trade.
Now we know the base strategy rules we can move on and start testing the individual factors.
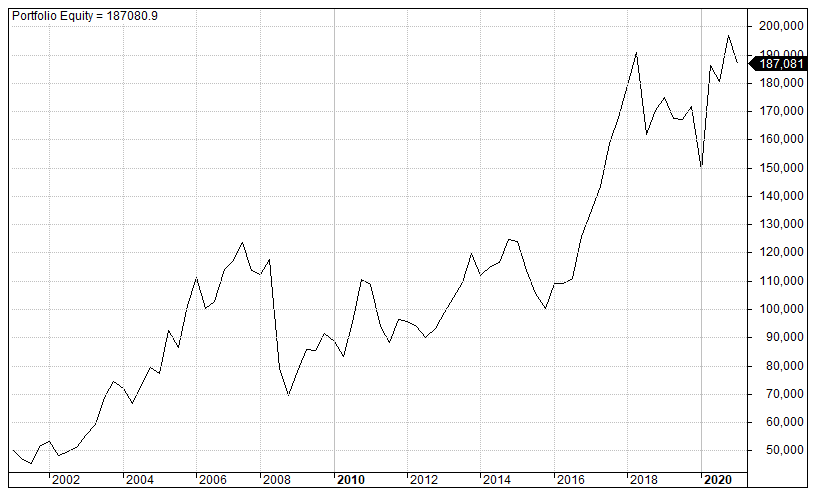
1. Price Momentum
In this first test we are testing pure price momentum. This is the most common type of momentum investing strategy.
For this test we are buying the top 25 stocks with the strongest price momentum over the previous four quarters and hold for four more quarters. The backtest runs from January 2001 to January 2020.
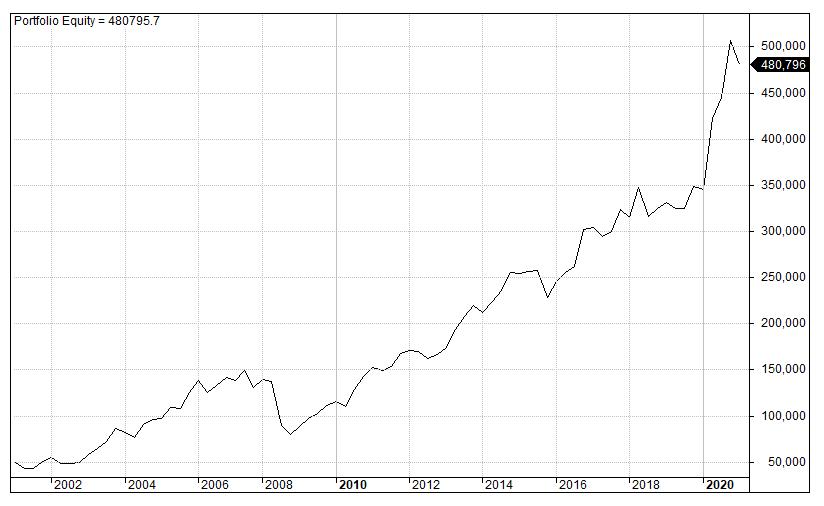
Backtesting the strategy between January 2001 to January 2021 on 8,000 US stocks we produced the following results and equity curve:
- Annualised Return (CAR) = 6.82%
- Max Drawdown (MDD) = -43.83%
- CAR/MDD = 0.16
- Win Rate = 52.76%
- Avg. P/L Per Trade = 7.46%
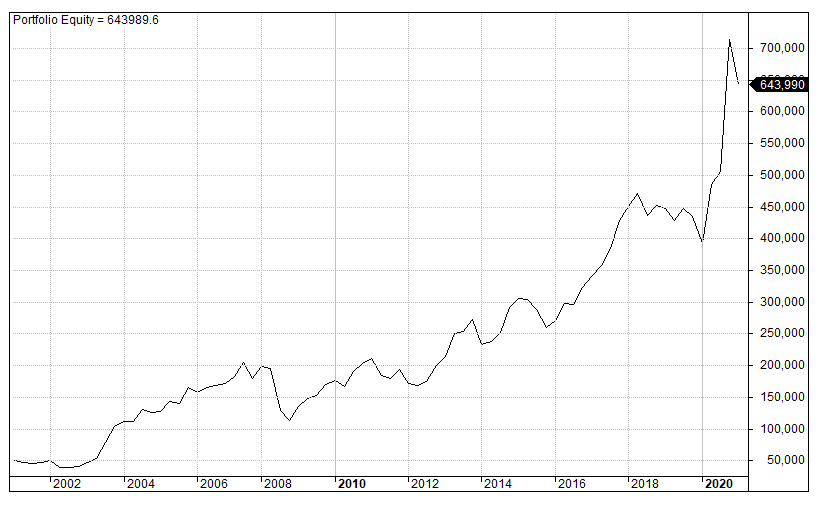
2. Revenue Momentum
For test two we will analyse revenue momentum.
In other words ,we are buying the top 25 stocks with the strongest revenue momentum over the previous four quarters and hold for another four quarters.
Backtesting this factor between 2001 – 2021 we produced the following results and equity curve:
- Annualised Return (CAR) = 13.62%
- Max Drawdown (MDD) = -44.97%
- CAR/MDD = 0.30
- Win Rate = 53.14%
- Avg. P/L Per Trade = 17.11%
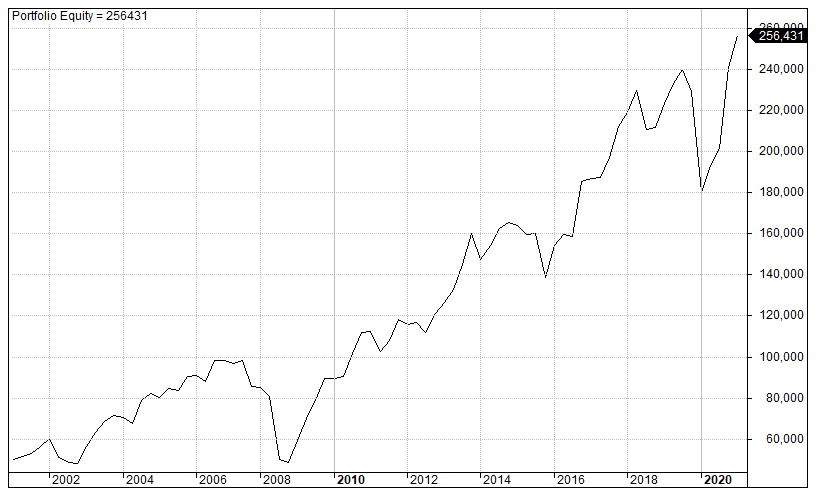
3. Net Income Momentum
For this test we are analyzing net income. Each year we buy the top 25 stocks with the strongest net income momentum over the previous four quarters and hold for another four quarters.
Between January 2001 to January 2021 we produced the following results and equity curve:
- Annualised Return (CAR) = 8.51%
- Max Drawdown (MDD) = -50.73%
- CAR/MDD = 0.17
- Win Rate = 54.86%
- Avg. P/L Per Trade = 9.19%
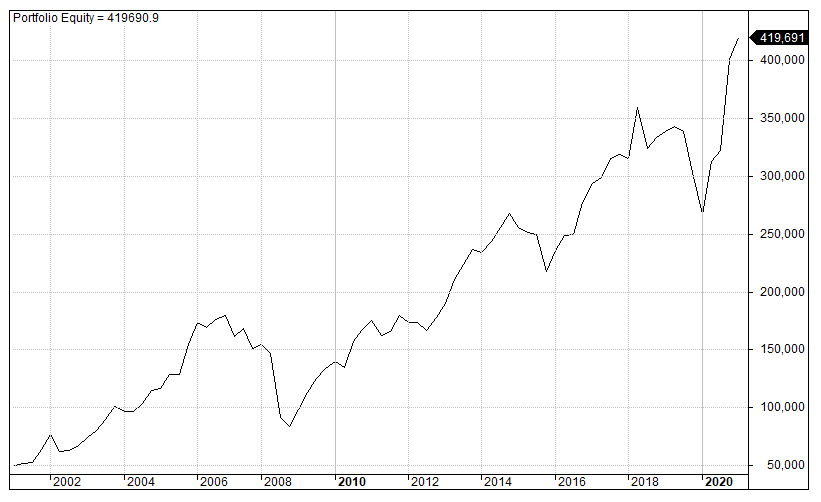
4. EBITDA Margin Momentum
EBITDA margin measures a company’s operating profit as a percentage of revenue. Using EBITDA gives a slightly more nuanced picture than gross profit or net profit margin.
For our test we will buy the top 25 stocks with the strongest EBITDA margin momentum over the previous four quarters and hold for another four quarters. In other words we are looking for stocks that have been able to increase their EBITDA margin the most over the last four quarters.
Between January 2001 to January 2021 we produced the following results and equity curve:
- Annualised Return (CAR) = 11.22%
- Max Drawdown (MDD) = -53.07%
- CAR/MDD = 0.21
- Win Rate = 57.52%
- Avg. P/L Per Trade = 12.31%
5. Four Factors Combined
For our final test we are going to combine each of the four factors mentioned above into a combined score.
Each variable is normalized and then given an equal weighting in the score. Thus, there is a maximum score of 400 on offer. The top 25 scoring stocks will be bought for the portfolio on a yearly basis.
Using the same settings as before we produced the following results and equity curve:
- Annualised Return (CAR) = 11.97%
- Max Drawdown (MDD) = -46.81%
- CAR/MDD = 0.26
- Win Rate = 59.05%
- Avg. P/L Per Trade = 12.72%
Summary of Results
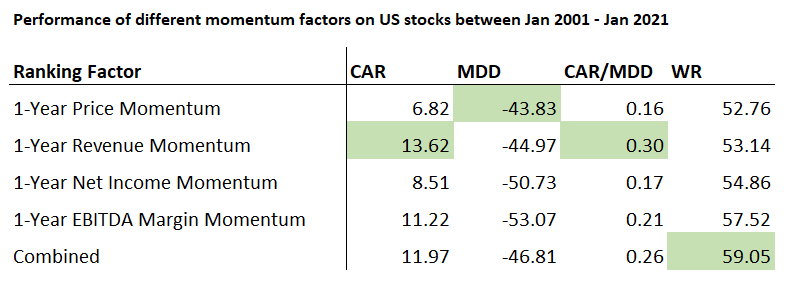
The following table shows a summary of the results that we recorded above.
As you can see, revenue momentum gave us the best return with a CAR of 13.62%. It was also the best factor according to return-to-risk. We got a CAR/MDD score of 0.30.
What is interesting is that price momentum is the most common investing strategy used by investors. But it is shown here to be weaker than fundamental factors such as revenue momentum and EBITDA margin.
Combining all four factors together also performed well but it did not outperform the revenue momentum factor.
Buy & Hold Comparison
For comparison, a buy and hold return on SPY between January 2001 to January 2021 was 7.51% annual return with a maximum drawdown of -55%. Therefore, all of our momentum factor, except price momentum, outperformed buy and hold.
Final Thoughts
In this article we analyzed four different measures of momentum to see which factors produce the greatest returns for investors. Although price momentum is the most common type used by practitioners we found that other measures such as revenue momentum produced strong performance.
One reason for this dichotomy is that fundamental data is not as readily available as price data. Therefore, the most common type of quant strategies are price based.
However, the data from this article suggests that investors would do well to consider fundamental data points in their momentum investing strategies. Revenue momentum and EBITDA margin show promise and are worth investigating further.
Notes: Analysis in this article produced with Amibroker using data from Sharadar.
The holding period is too long for price momentum. Also: Formation period of 6 months should also improve the price momentum strategy.
Interesting
If selling a stock as hi as possible then price is what you measure.
But if èarnings (which is a quality measure) is what you want this appeals to a more fundamental business metric, and reflects the more mature perspective.
It wins out
Can you define momentum as it is used in these studies?
Normalised rate of change.
Sorry, but could you define this programmatically? I’m not very exp. in tech. analysis.
You can just use RSI. It is momentum indicator.
What was the calc. you used to sort stocks by “strongest revenue momentum?”
I would add a filter on the stock or that momentum on PRICE has to be > 0
let me know if you add this test to this good article of yours
Consider also, if possible, a score on low volatility using a six or 12 months (daily data) of standard deviation of price returns.
Thank you
The most straightforward method of measuring performance is the Rate of Change (ROC) on whatever factor is being considered, whether that’s Revenue, Operating Income, or simply the Stock or ETF’s Price.
In Portfolio123, Rates of Change (ROC) on Price can be narrowed to specific periods in a Ranking System. For example, stocks or ETFs that have seen steady gains for 1-year, 6-months, 3-months, 1-month, etc. can be specified in the Ranking System using these parameters:
ROC(250,1)
ROC(125,1)
ROC(63,1)
ROC(20,1)
The Ranking System will provide an ordered list of equities with the highest rate-of-change for each of those periods. While this may sound like a great way to find good stocks or ETFs, my experience has been that if equities have been climbing strongly in all those periods, they may be good candidates for a selloff.