In this article I test another simple trading idea that is designed to find high probability stock moves.
It’s three o’ clock in the afternoon, the sun is still shining, and I have already spent several hours testing out another trading idea. (Although by the time this post is finished and published it will be much later).
The trading system idea is so simple I doubt it will work. But, in the knowledge that simple trading ideas are often the best, I continue in search of the holy grail. Besides, you can never know if an idea is a good one until you the put the system down into code and test it out for yourself.
A simple trading idea to find high probability stocks
As so often, the search for a trading system begins with a simple idea that stems from watching patterns in the markets.
Take a look at some stock charts and what do you see? Isn’t it obvious that some stocks just keep going up and up, every day printing higher and higher closes?
Many seem to run in predictable upward trends, whereby a series of green candles in a row usually predicts further green candles to come. On the other side, those stocks continuously printing lower closes tend to carry on losing.
Or is all of this simply an illusion? A cognitive bias, and the markets are actually random after all?
There is only one way to find out.
The nuts and bolts
The idea behind this trading idea is based on both the concept of trend following and some rudimentary probabilities. In essence, the question behind the trading idea is this:
If a stock closes up 10 days in a row, is it more likely to close higher the next day as well? Can that idea be used in a profitable trading system?
To test this concept, I decided to load up historical data for stocks in the S&P 500 universe into Amibroker. I then created some simple Amibroker code.
The following code simply ranks each stock in the universe by the number of times it has closed up in the last 10 days. It does this using the SUM function and PositionScore. As below:
Rise = close > open;
Days = 10;
TotalRises = Sum(rise, days);
PositionScore = TotalRises;
The TotalRises value simply counts the number of times the stock has finished higher than the open in the last number of periods.
Test One – Daily
Using the above code, I instructed Amibroker to scan the S&P 500 universe each day and buy the stock that had had the most up days in the previous 10 days. Trades would be entered on the open and exited on the same day close.
Position size is set at 100% of equity with a starting capital of $100,000 and the system is first run between 1/1/2010 and 1/1/2015 with no commissions set.
Test One Results:
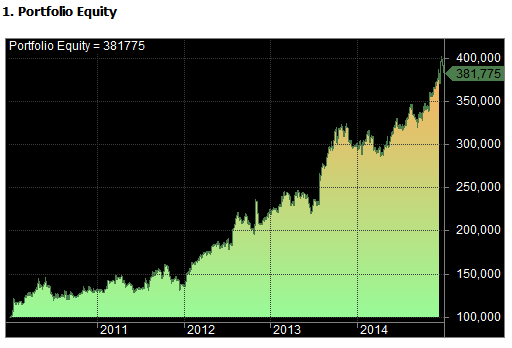
As you can see from these results, the simple trading system appears to be a good one. Buying high probability stocks, ones with the most up days in the last 10 day period produced a compounded annual return of 30.78% with a maximum drawdown of -18.50%, giving a CAR/MDD of 1.66. 53.02% of trades were winners.
Here are the last 10 trades from the system:
Let’s add in commissions
The system looks good so far.
However, if we now add in commissions of $0.01 per share, you will see that the picture changes.
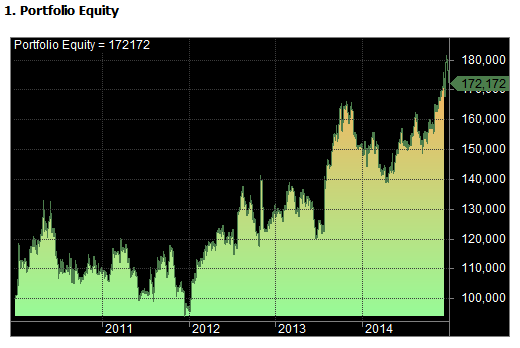
By increasing costs, compounded annual return drops to 11.50% and the drawdown increases to -29.15%. The system has gone from having a smooth, upward equity curve to one that is much more choppy.
Test Two – Weekly
Since commissions clearly had a significant effect on trading profits, it might be an idea to try the trading system on a longer time frame.
Thus, in test two, I keep commissions at $0.01 per share. But this time, the system will buy the stock that has closed up the most number of weeks in the last 25 weeks. Trades are then entered on Monday morning and closed on the Friday close.
Test Two Results
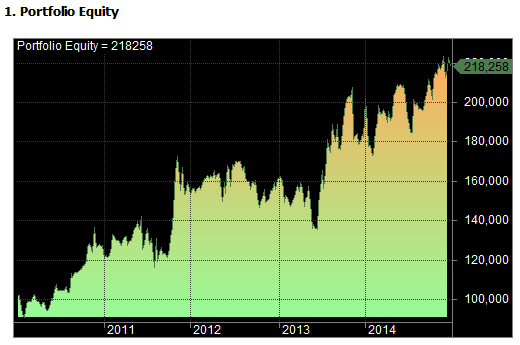
As you can see, the system performed well and produced a compounded annual return of 16.94% between 2010 and 2015, with a maximum drawdown of -21% and a CAR/MDD ratio of 0.79.
Casting some doubts
On the face of it, this simple trading idea looks like it might have some merit. However, all trading ideas require significantly more investigation than provided so far and there are some outcomes that cast some serious doubts on the effectiveness of this strategy.
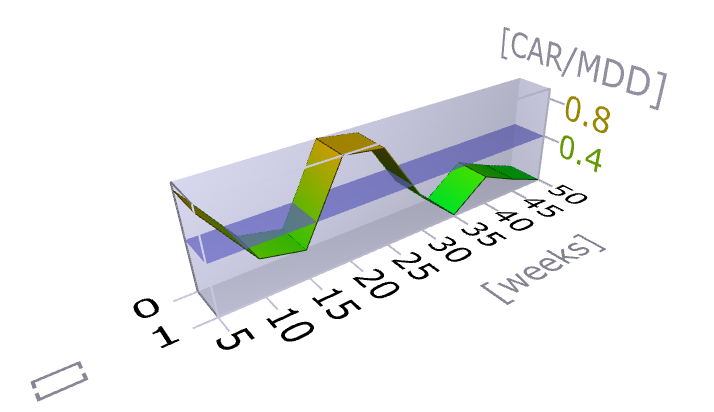
First of all, an optimisation of the look-back length (number of weeks) returns some very inconsistent performance metrics.
This suggests that the previous good performance of test two might just be random.
Furthermore, stress testing the trading system on different dates (before and after the test period) produces volatile and unstable results. An obvious reason for this is the lack of diversification, since the system only holds one stock at a time.
Test Three Monthly
It’s clear that the trading idea we have come up with needs more work.
Therefore, in this final test, I turn the idea into a portfolio system and increase the timeframe to monthly.
This system buys the 20 stocks with the highest number of positive months, in the preceding 24 months. In other words, a stock that has gone up 20 months out of the last 24 months is preferred over a stock that has gone up only 12 months of the last 24.
Equity is split equally between each stock and trades are entered at the beginning of the month (on the open) and closed at the end of the month, (on the close).
Lastly, a market timing filter is introduced so that trades can only be entered if the S&P 500 is also trading above it’s 6-month moving average.
Test Three Results
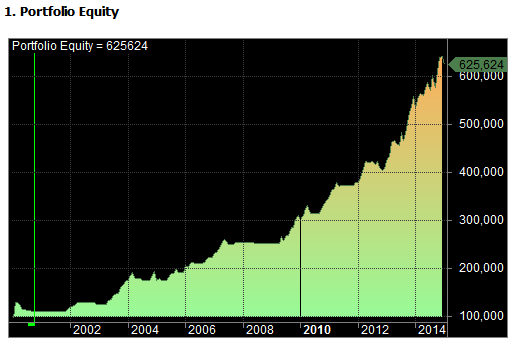
Running test three from 1/1/2000 to 1/1/2015 produces the following equity curve:
As you can see from the results, performance for the monthly system was good, with a compounded annual return of 12.99% and a maximum drawdown of -14.06%. This gives a CAR/MDD ratio of 0.92. The equity curve is nice and smooth and 61.71% of trades were winners.
Summing up
Essentially, this is a type of trend following system but it’s not clear yet whether this system is robust enough to trade live. In out-of-sample testing the strategy is currently showing a drawdown of -9% after the recent market drop.
I was actually willing to give up on this trading idea after test one, where some erratic trade results were shown. However, by extending the time horizon out to monthly, the strategy does appear to have some potential.
Systems run using Amibroker and survivorship-bias free data from Norgate Premium Data.
You may also like:
– A short-term reversal strategy that beats the market
– How to hedge a portfolio in Amibroker
– Trend Following System For Stocks

