
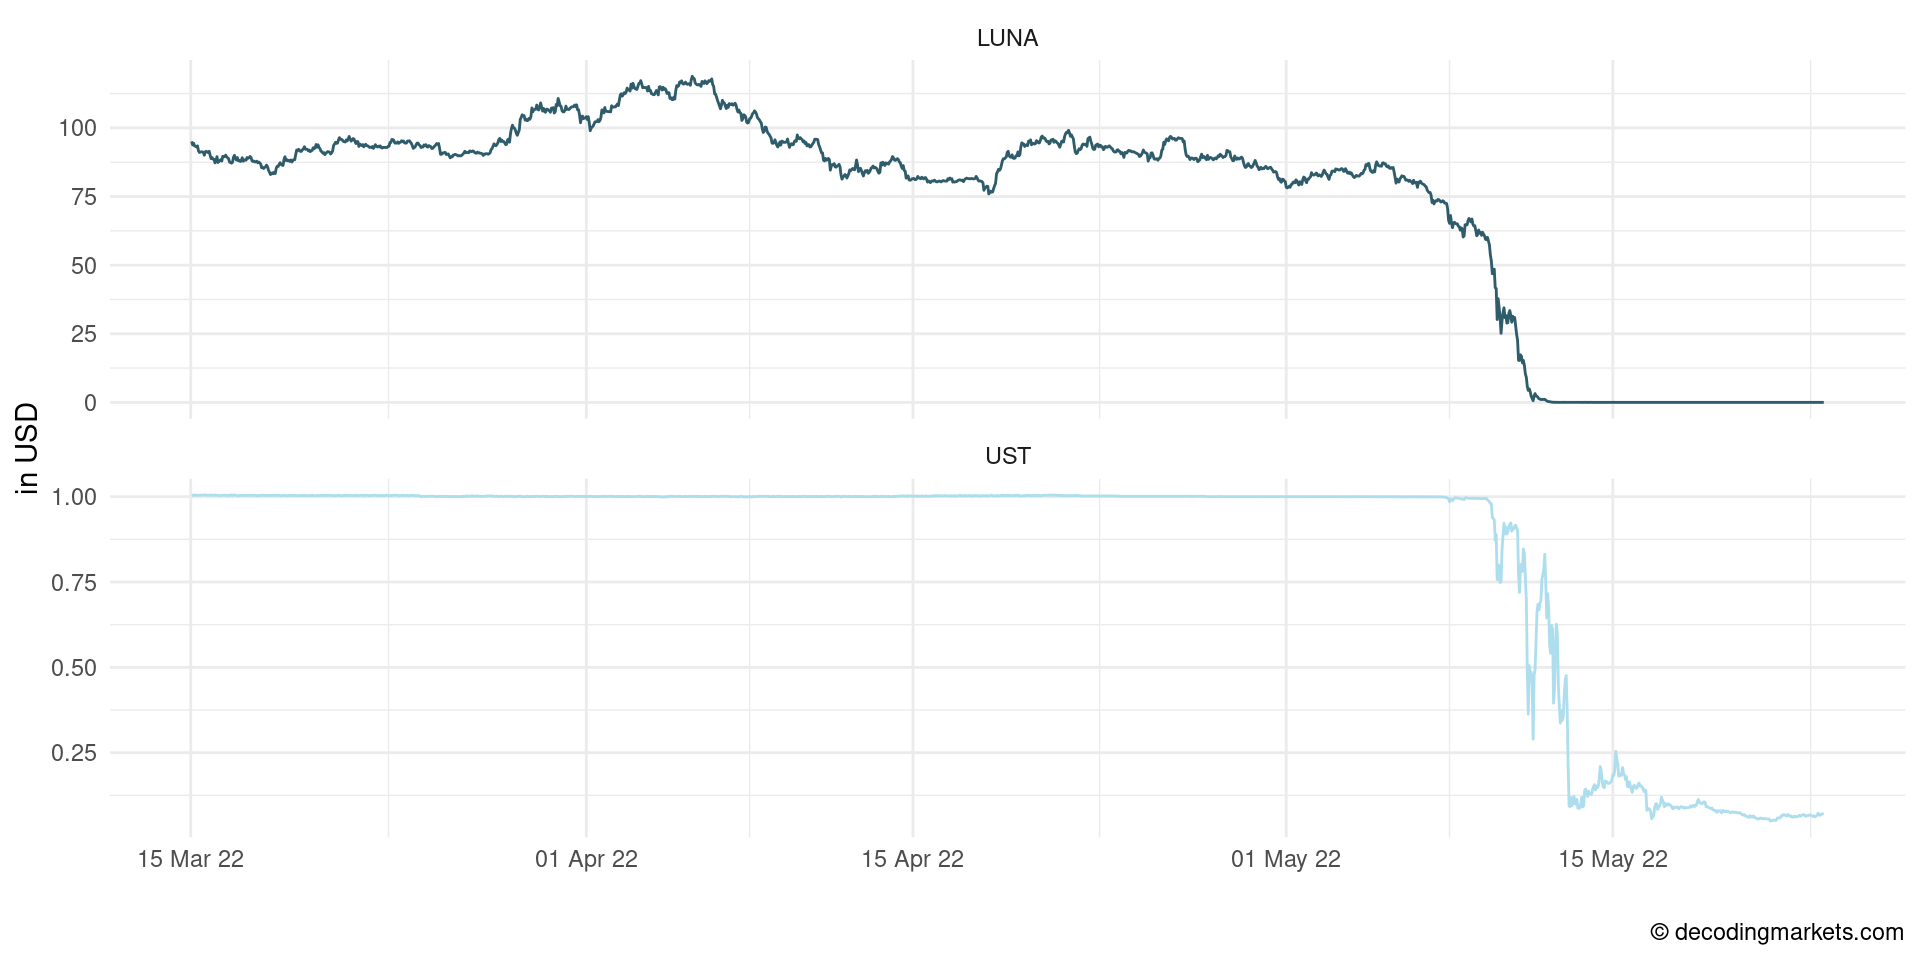
The success story of the innovative Terra ecosystem with stablecoin Terra USD (UST) and Terra LUNA coin came to an end recently. As of the time of writing, the Terra blockchain has been halted.
The LUNA currency was worth over $100 in April 2022. The price collapsed to below $0.0002 in a matter of hours. The stablecoin UST is now worth only $0.1 instead of one US dollar. Why has the system crashed?
What was innovative about the Terra network was its mechanism to generate a quasi-stable currency peg. While other stablecoins like Tether create physical (cash reserves), Terra ensured stability through an algorithm on its network and tying it to LUNA.
A constant UST price was to be achieved by buying and selling UST and LUNA. The goal: One UST should always have the equivalent value of one dollar in LUNA. As long as enough investors believed in this working, it worked brilliantly. The rest is history.
Despite a market capitalization of nearly $40 billion at the beginning of April 2022 (ranking 9th among the largest coins), Terra can be considered a sideshow. Still, the consequences for the entire crypto space are more significant than an outsider might imagine. Bitcoin has also lost more than -35% from its high. And so has Ethereum (-45%), Solana (-70%), and almost all the rest.
Many argue that the selloff in the crypto space was primarily caused by the Terra incident. Adverse events in one corner of the market can cause the whole market to panic. At the same time, favorable circumstances (such as Bitcoin reaching new ATH, as for example in 2017 and 2021) can also have spillover effects on other cryptos. For example, by attracting new investors, which in turn drive up the price of other cryptos as well.
Measuring Daily Spillovers
A relatively recent piece of research suggests that cryptomarkets exhibit a high level of market connectedness. The authors find that “Bitcoin is a net transmitter of return spillovers during busts and a net receiver during booms.”
To get to the bottom of this, we will create correlation networks. We work with daily and hourly data from CryptoCompare (on Nasdaq Datalink).
The crypto universe used for this analysis is built up of the six highest capitalized non-stable coins as of every start of the year since 2016: ADA, AVAX, BCH, BCN, BNB, BSV, BTC, BTG, CRO, DAO, DASH, DOGE, DOT, EOS, ETC, ETH, GNT, LINK, LSK, LTC, LUNA, MIOTA, NEO, NXT, PPC, REP, SHIB, SOL, STRAT, TRX, UNI, WAVES, XEM, XLM, XMR, XRP, and XTZ. Not all are available at every moment, in which case the missing coins are removed from the sample.
The following graph shows the daily correlations between the price chage today and the following day. An arrow from crypto A to crypto B means that A’s price change today is predictive of B’s price change tomorrow. For this analysis, the price is always against the US dollar.
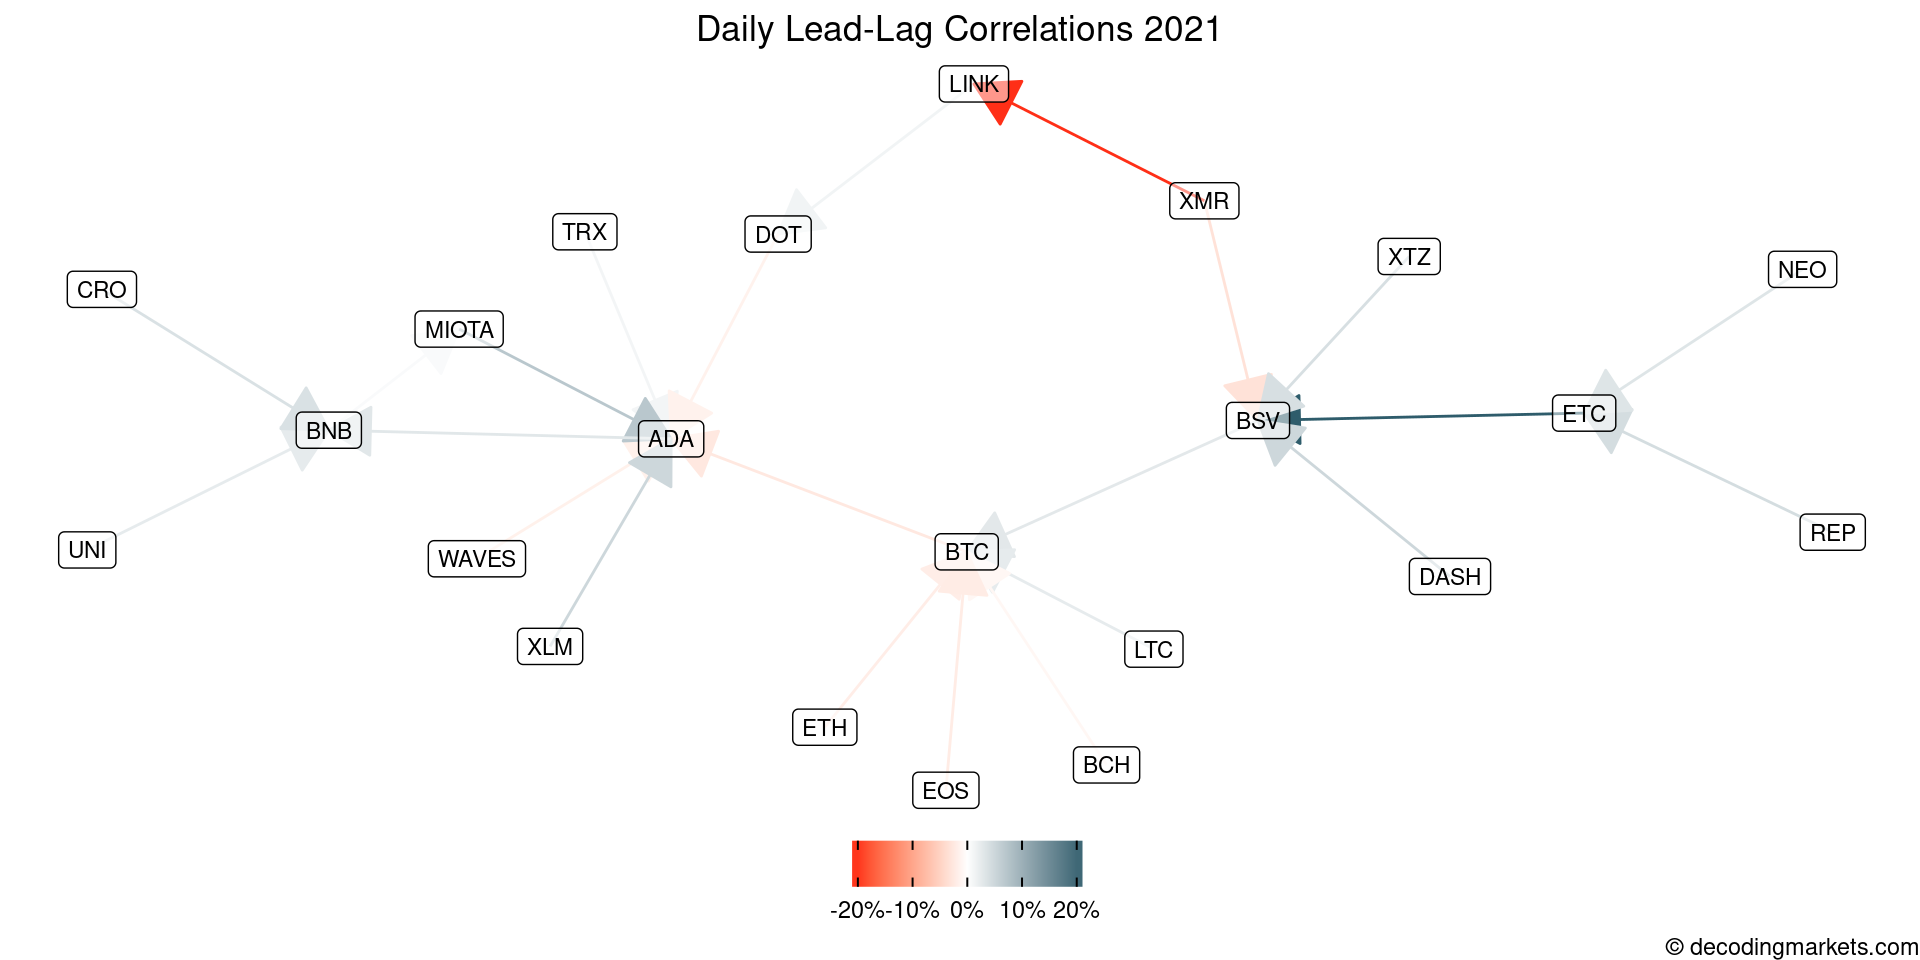
In 2021, looking at daily returns, ETC (Ethereum Classic) had a positive correlation with the next day’s BSV (Bitcoin SV) return by a coefficient of 0.2 (or 20%). XMR (Monero), on the other hand, had a negative correlation with the next day’s LINK (Chainlink). LINK by itself correlated with DOT (Polkadot) etc.
The correlations are relatively small. But knowing which asset influences which other asset going forward can be highly valuable for a trader. It’s like if you can guess the flip of a coin correctly with a 51% chance (instead of 50%). If you can place bets at 1:2 odds and the gamble repeatedly, this tiny edge can make you rich.
A further interesting observation from the 2021 daily correlations is that BTC is negatively correlated to the previous day’s ETH. That is, on average, when ETH went up (down), BTC went down (up) the next day.
Correlations are not set in stone and will change over time. In 2020, for example, the image was quite different.
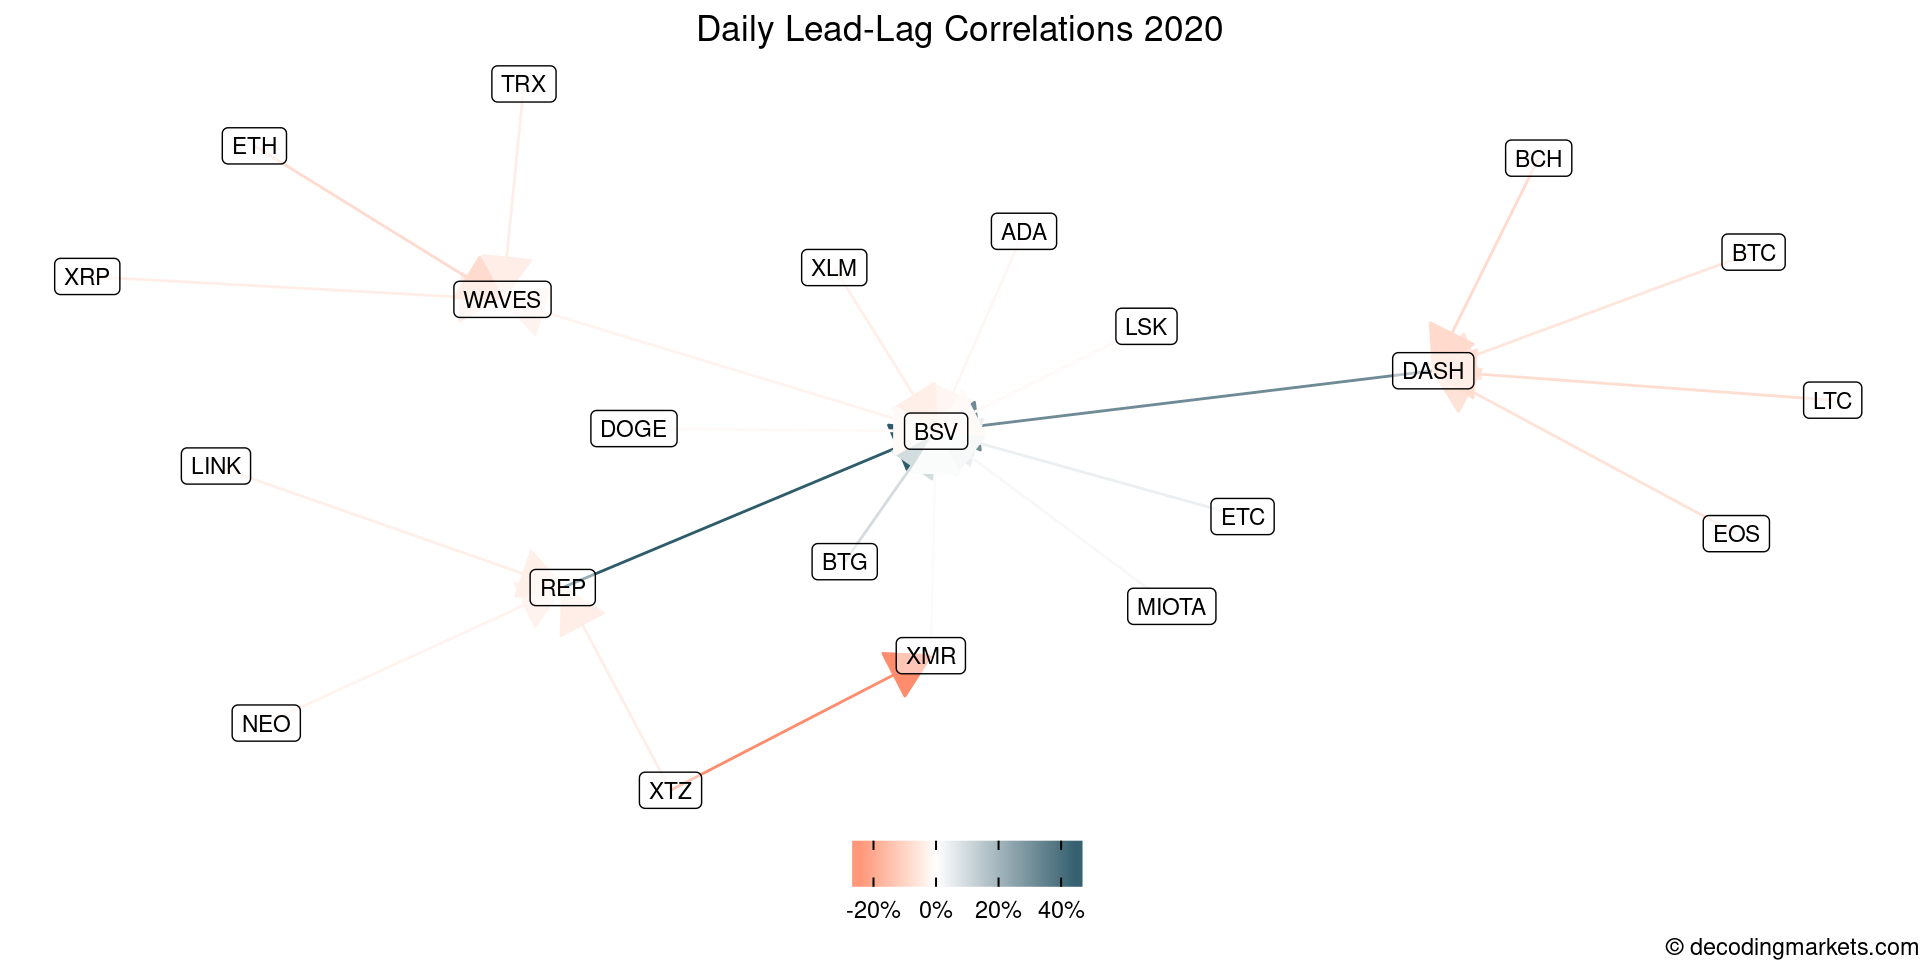
We see that BSV was still lagging, but in 2020 the driving forces were REP (Augur) and DASH. The other correlations mainly showed red, indicating that we had day-to-day mean-reversion overall.
Intraday Correlations
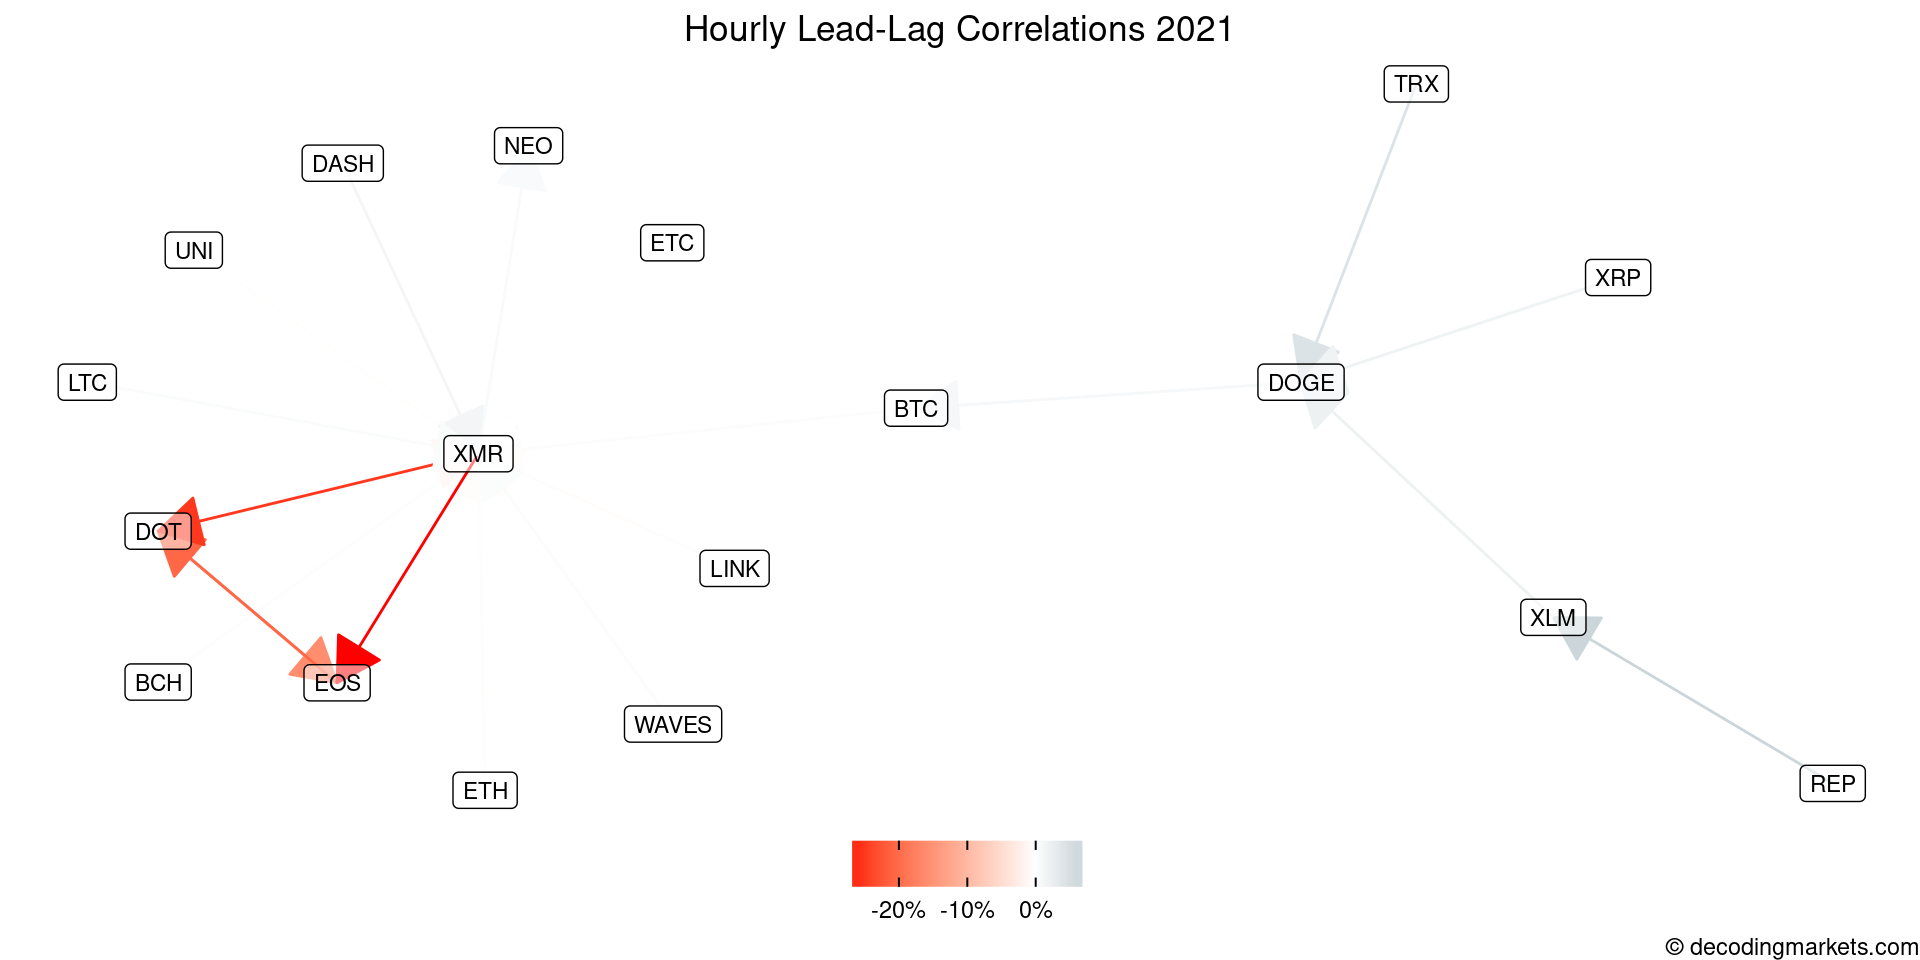
On a more granular level, we can do the same using intraday data. The following graph shows the hour-to-hour correlations from 2021.
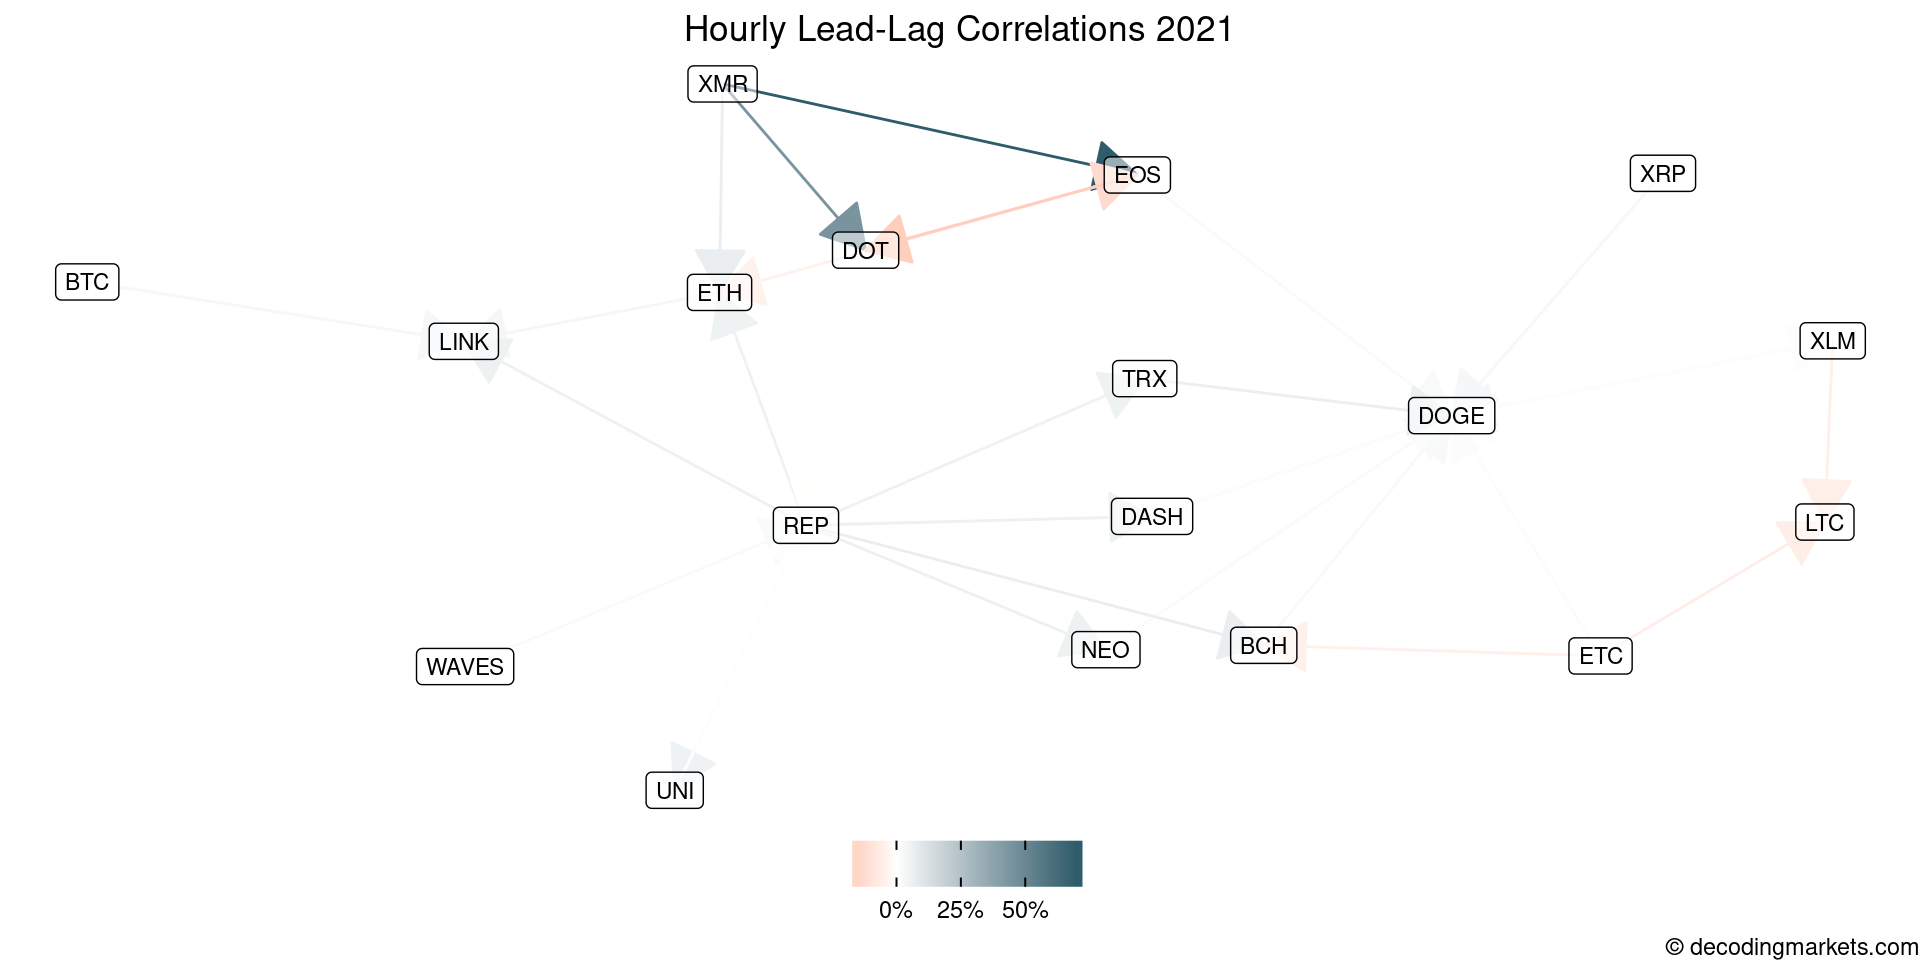
Here, XMR had a positive impact on EOS, on DOT, and weakly on ETH. BTC, ETH, and REP all had a weak influence on the following hour’s price change of LINK.
With a 2-hour lead-lag relationship, we find, apart from one prominent threeway relationship, only relatively weak dependencies. The two coins that seem to react negatively are DOT and EOS, which both also negatively depend on XMR. So following a price increase in XMR, one could expect DOT and EOS to drop (and vice-versa), and even more so if one of DOT or EOS also significantly went up or down.
Trading Crypto Correlations
What we have seen so far are only apparent correlations. Correlations are signs of possible influences. One can take away hints on how to build a successful strategy but they are no guarantee of success.
Let’s stick with the observation that BSV was driven by the previous day’s change in ETC. If we believe that this relationship is also valid for the future (for 2022), then we could trade the rule that if ETC is up one day, we go long BSV, and if ETC is down, we go short BSV. How would this have done?
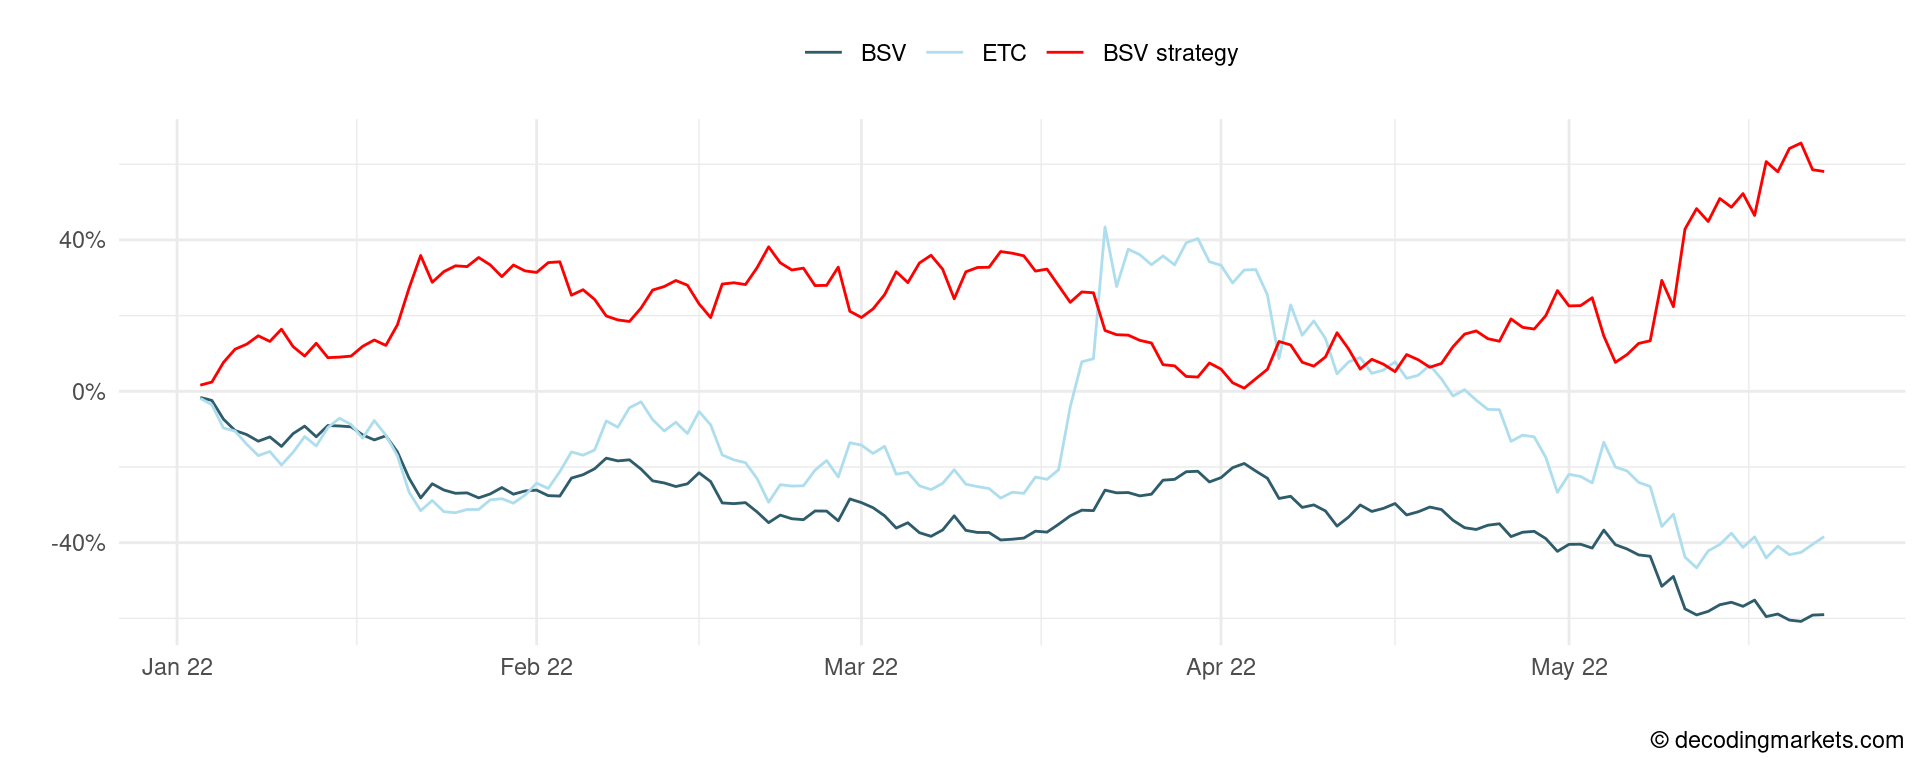
While both BSV and ETC lost at least 40% YTD, the BSV strategy (trading on past ETC return) went up 50%. This excellent result was made possible by short-selling on the right days. Actually, the strategy was short-positioned on 90% of trading days.
Another insight from our previous analysis is that XLM had a positive influence on ADA. This can be incorporated and tested in a similar way as BSV-ETC.
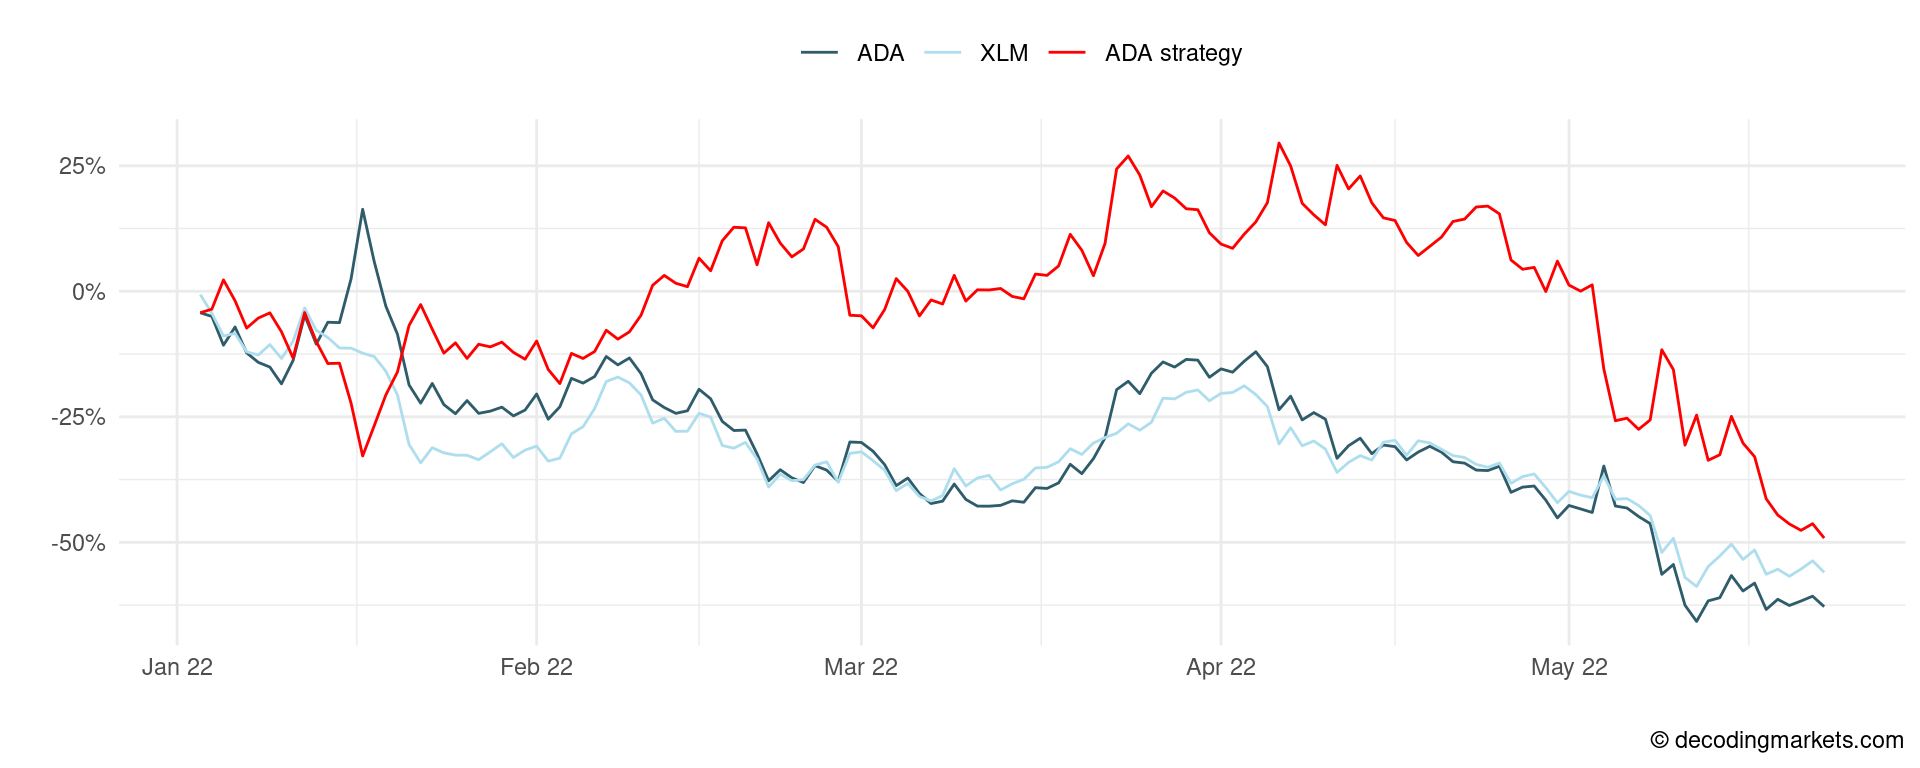
Up to the end of April, the ADA strategy based on the lagged change in XLM was in positive territory (while both ADA and XLM were already down substantially YTD). In May, the strategy could not keep its edge and also encountered losses.
This was just an example. To build a successful strategy, one needs to optimize further and regularly check the performance.
Final Thoughts
The market efficiency hypothesis states that it is impossible to permanently achieve above-average profits because all information is priced in. It would be too trivial if price information from an hour before gave you a reliable hint in which direction an investment will move.
Sam Bankman Fried, the founder of FTX, built a fortune arbitraging between different crypto markets. In a nutshell, he would buy Bitcoin on US exchanges and sell them at a premium on Japanese exchanges. Such “free lunch” opportunities, of course, vanish when pros (such as Sam) play them. With any correlation signal that we find in historical data, we have to ask if this has any chance of staying that way in the future.
With increased efficiency in crypto markets, it becomes a bit harder to win. To learn more, you can also check out this course on the most successful crypto trading strategies for 2022.