Repainting indicators can be very harmful if not used correctly. They are especially dangerous to systematic traders because a repainting indicator typically produces backtest results that are too good to be true.
Repainting indicators are particularly pernicious when dealing with complicated formulas and strategies. This is because it can be hard to tell whether an indicator is repainting or not.
In this article we will talk about the perils of repainting indicators and provide a simple trick to test whether or not you are dealing with a repainting indicator.
What Is A Repainting Indicator?
A repainting indicator is an indicator that changes its values as new data arrives. When the historical values of the indicator change, they cannot be relied on for backtesting since they are not point in time accurate.
In other words, when you look at the indicators values you are not looking at how they were at the time, you are looking at a new version that has been adjusted to the most recent data.
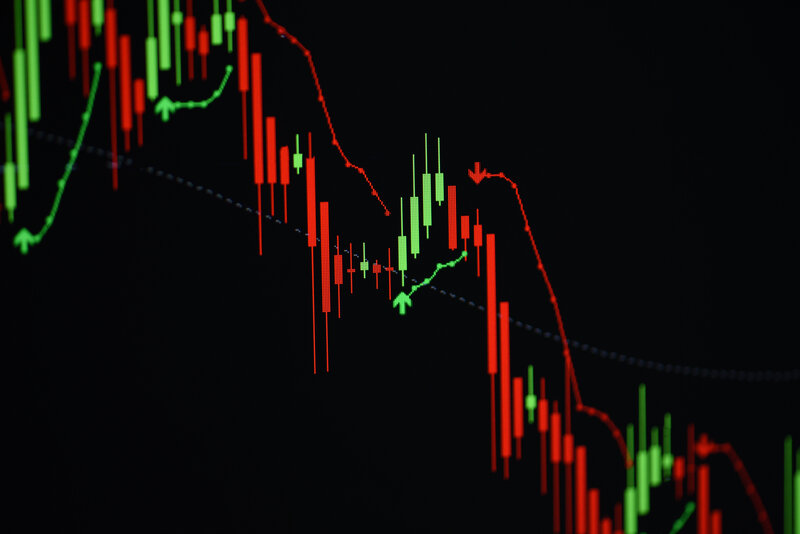
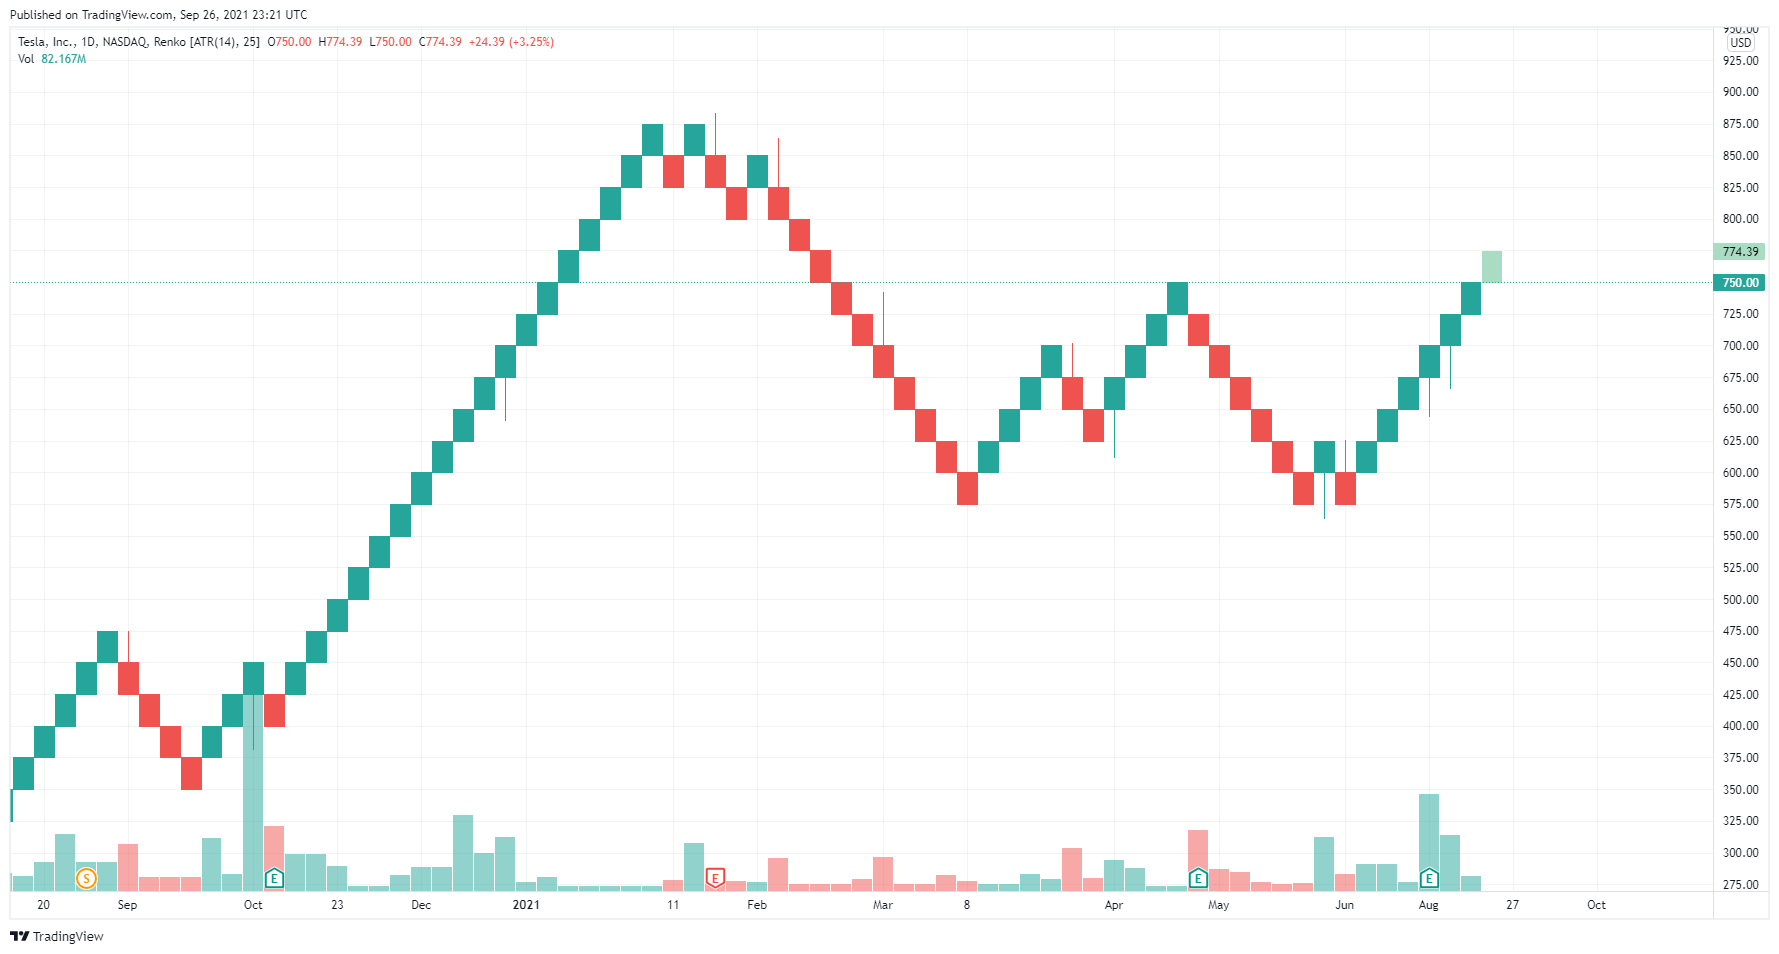
If you have ever used Renko charts then you may have seen this with your own eyes. One minute, you are looking at a series of green Renko bars, then suddenly the market moves quickly and those green bars suddenly and magically turn to red. In other words, all of the past values have changed with the addition of new data.
Because the historical values of repainting indicators change with each piece of new data, they cannot be used in a backtest. Using them in a backtest often results in extraordinary results that are too good to be true. Repainting indicators are able to give near perfect buy and sell entries because the indicator is constantly changing to future data.
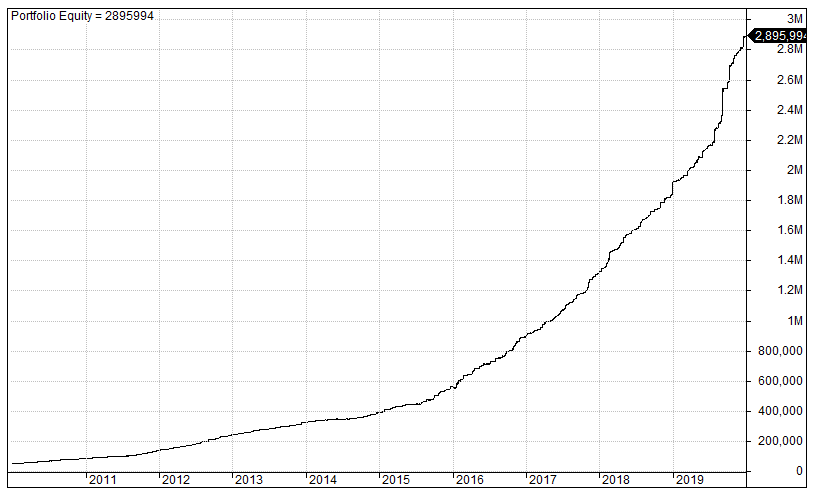
The equity curve below shows the performance of a trading strategy that uses a repainting indicator called a super MA. This backtest performance is clearly unrealistic and will not be reproducible in live trading.
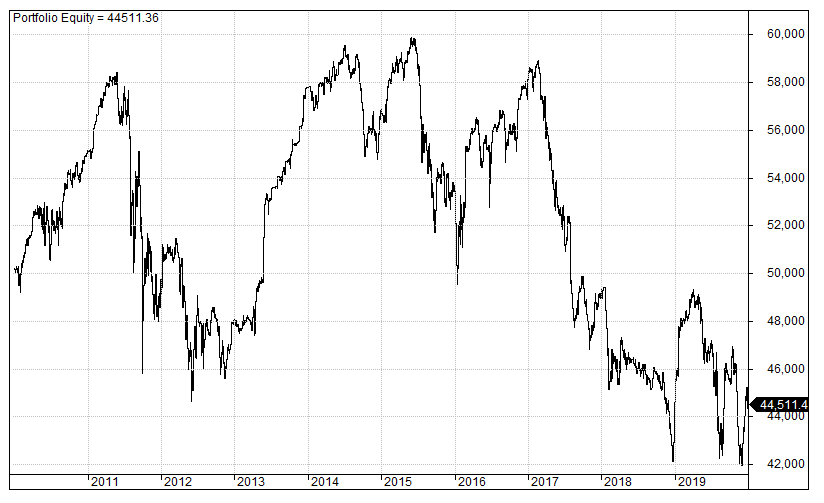
Once the problem formula is turned into a non-repainting indicator you can see that the equity curve is completely altered. The repainting indicator produced an incredible equity curve but the true system is actually a loser. This is the big danger when backtesting a system with a repainting indicator:
How Do You Know If An Indicator Is Repainting?
The problem with repainting indicators is they can be difficult to spot. When dealing with a complex formula, it sometimes isn’t clear that you are dealing with a repainting indicator.
One time I spent hours working with an unbelievable trading system. The system was making 40% annual returns every year in the backtest with a high win rate and minimal drawdown.
I knew there must be something up with the system but I couldn’t put my finger on what it was. I wondered if there was a mistake in my code or if the system was curve fit to the historical data.
Eventually I worked out that one of the formulas in my code was referencing a future bar. I had a head and shoulders formula that was using a future close price in order to complete the pattern.
Once the code was fixed, the system produced a more realistic return which was less than buy and hold.
If you want to run a true and reliable backtest you must use indicators that are not repainting. After the bar is closed an indicator’s values should never change.
Simple Trick To See If An Indicator Is Repainting
Fortunately, there is a simple way to check whether you are dealing with a repainting indicator. All you need to do is take note of the historical values of the indicator and then wait for new price data to arrive.
Once the new data is in, take a look at the historical values of the indicator again. If the historical values are different from before then you know you are dealing with a repainting indicator.
If you are backtesting a strategy using historical data, another way to check for a repainting indicator is to manually adjust the price quotes.
For example, take a note of the indicators previous values then adjust todays stock price data by a large amount. If the indicators previous values change, then you know you have a repainting indicator.
In Amibroker, you can do this by going into the Symbol/ Quote Editor window. Adjust the quotes for the most recent day and then see what happens to the indicators historical values. In the example below I have drastically altered the close and high price of Agilent Technologies to $182.44 and $183.44:

Repainting Indicator Example
The graphic below shows an example of repainting using the Zig technical indicator. The Zig indicator is a notorious repainting indicator that references future values to find peaks and troughs. In this graphic it has been applied to Starbucks stock (SBUX).

You can see that with the original price data on the left the Zig value is 115.38 on the 27th August and 116.43 on the 30th August. We then alter the close price of SBUX (on the right). The 31st August close is altered to $113 changing the trend of the stock from up to down.
Notice that the historical values of the Zig indicator change too. The Zig value has changed to 114.97 on the 27th August and 115.61 on the 30th August. In other words, the Zig indicator is changing based on new received data. This leads to repainting and lookahead bias.
Tip: When you practice this method make sure to check more than once. If the new data is not different enough a repainting indicator may not change its historical values, even though it is repainting.
How To Stop An Indicator Repainting?
The only way to stop an indicator from repainting is to get your hands dirty and dig into the code. You will need to go line by line and look for any code that may be referencing future price bars. This can be difficult when dealing with complex formulas and it’s near impossible when the code has been locked by the original copyright holder.
Unfortunately, some unscrupulous vendors have made a living out of promoting repainting indicators to unsuspecting customers. Because these indicators pick out the tops and bottoms so easily, they make for compelling marketing material.
In addition, these indicators are often made extremely complex which means customers are unable to understand if the indicator is repainting or not.
This practice is especially harmful when the trader uses the indicator in a backtest. The superior performance gives the trader undue confidence in a strategy that is in fact full of bias.
Best Non-Repainting Indicators For Trading
Repainting indicators are not necessarily bad if they are used in the right setting. Discretionary traders may be able to use repainting indicators like Renko charts to better understand current price trends.
Moreover, repainting indicators like Zig can be used to evaluate the profit potential of a security. These indicators can show what profit could be achieved from perfect buy and sell orders. Stocks with greater profit potential can then be preferred over stocks with lower profit potential.
However, the inherent limitations of repainting indicators mean that they cannot be used for any form of historical analysis or backtesting. For this type of research it is best to use classic non-repainting indicators like RSI, moving averages and Bollinger Bands. I have provided an explanation of some classic technical indicators here.
Unfortunately repainting indicators are just one of many traps that can trip up discretionary traders and system traders alike. Through our courses and blogs we detail all of the other backtesting mistakes that traders need to avoid to build profitable systems.
Hey man thanks for this holy shit this makes so much sense, I have been using soft4x and strategy tester on my mt4 but no luck. I can just write down the current date and a few back and come back later to see if anything changed, genius.
good read, never come across good stuff like this.
Hey man, thanks alot. I didnt know this stuff. You have saved alot of trouble. Simmy23