The past few weeks I have been working on a new value investing strategy and Udemy course that I am calling the Marwood Value Model. This is an original strategy that I developed some time ago and one that has produced some excellent recent trades on small and mid-cap US stocks.
Recent Trades
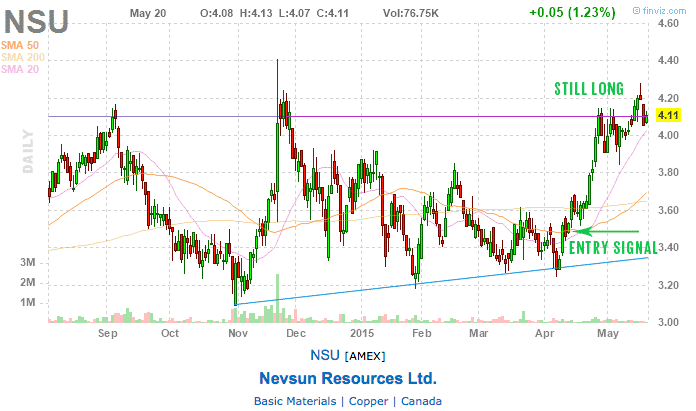
For instance, in March of this year, the model singled out Nevsun Resources $NSU. Nevsun is a copper producer that operates the high grade Bisha mine in Eritrea, East Africa. At the time of selection, NSU was trading around $3.50 and it’s now trading around $4.11. That’s a 17% gain in just over a month with more potential upside ahead.
In another recent example, the model picked out Shanda Games Limited $GAME at the beginning of March. GAME is a Chinese technology company that trades on the Nasdaq. I wrote about the company in a Seeking Alpha article on the 6th March and said how the company had been selected for outperformance. Then, on the 3rd April, it was announced the company would be taken over in a $1.9 billion deal. Shares immediately jumped to $6.80, giving a 19% gain in less than a month.
This is a strategy that I now use myself to select stocks as part of my overall diversified trading portfolio. If you have a momentum or trend following system, the value investing model is a great way to add an uncorrelated system to the mix and reduce drawdown. So far, I have been extremely pleased with it’s back-test performance and out-of-sample results.
System Performance (what you really want to see)
In the upcoming Udemy course, I plan to share the exact rules and settings that I use to select stocks for the Marwood Value Model. The entire process is recorded live using the Portfolio123 simulator where it is possible to back-test strategies using institution-quality fundamental data, all the way back to 1999.
For sure, this is an expensive tool but the model has been specially designed to be used outside of the Portfolio123 site with the use of completely free online tools. That means you don’t need to purchase any additional software or data to use the model.
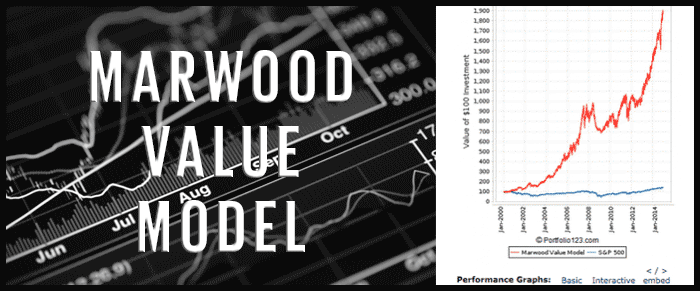
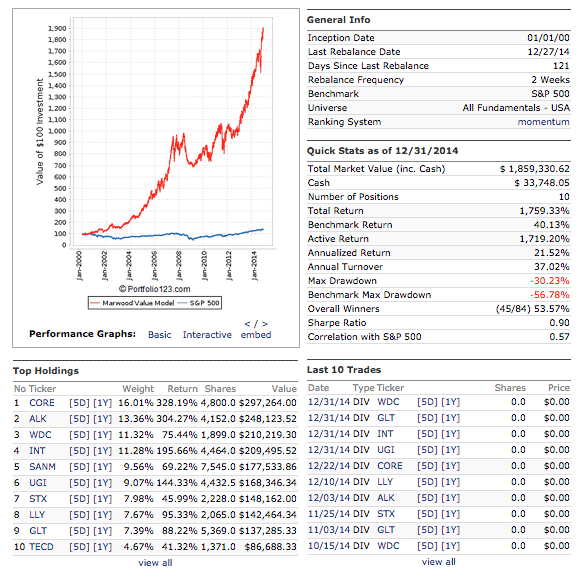
As you can see from the following back-test results, the performance of the system has been good:
From 1/1/2000 to 12/27/2014, the strategy produced an annualised return of 21.52% with a maximum drawdown of -30.23% and an overall win rate of 53.57%. This was much better than the performance of the benchmark S&P 500 (blue line). The Sharpe ratio was also high at 0.90 and correlation to the S&P 500 was 0.57.
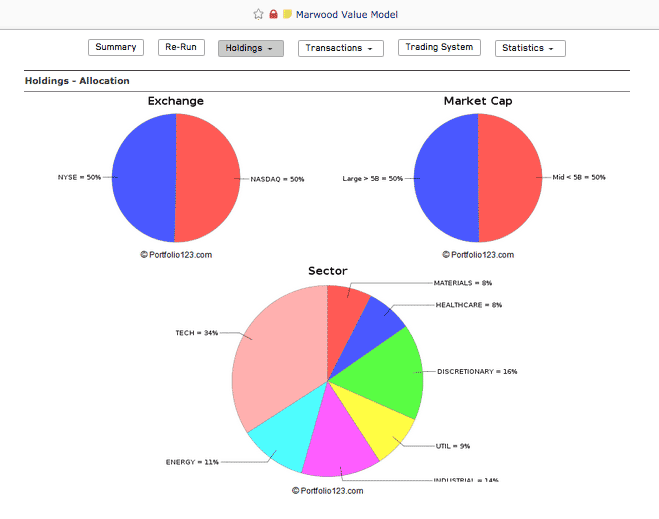
Following are some more charts and analysis from the system:
In the first selection of charts, you can see that the model maintained a well balanced portfolio regarding capitalisation and sector. The system was most strongly weighted in technology with 34% of the portfolio held in tech stocks.
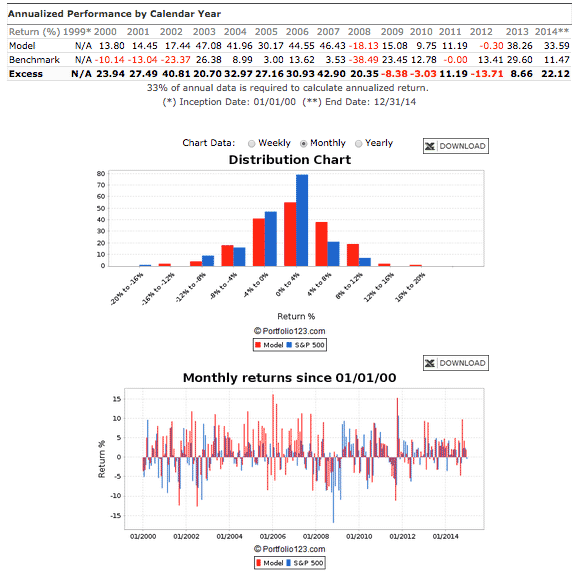
Next up, you can see the annualised performance breakdown by year. The model only lost money in 2008 and 2012 and performed strongly in 2013 and 2014.
Highly Flexible & Easy To Use
The Marwood Value Model is based around 10 key rules for buying and just one rule for selling.
Of course, the rules are not simply plucked out of thin air. They are grounded in the principles of successful value investing. They take their cues from academic research and align with the viewpoints of all the most successful value investors of our time.
The nature of this strategy makes it both highly flexible and easy to use. Entries and exits are made every two weeks, which means this is another strategy that requires very little maintenance.
It is the perfect strategy to combine with another system, such as a trend following system, a short-term trading system, or growth investing system.
By using more than one system together, it is possible to reduce drawdown and risk – so long as those systems are significantly different from one another.
How the strategy came about
As I’ve mentioned above, the actual story about how the Marwood Value Model came about is not a random one. In fact, the rules for the strategy came about after I realised that many of my best performing stock picks all shared the same inherent characteristics.
Characteristics such as strong cash generation, low price-to-book values and consistent earnings growth. To my delight, when I put these simple rules into the Portfolio simulator to test, they worked amazingly well. First time!
I then spent some time tweaking and fine-tuning the rules, particularly the exit, and I found that the most success came from keeping everything simple and straightforward.
What you’ll need and what else is on the course
The length of this course will be 2-3 hours, roughly the same as my trend following course, which means you’ll be able to go through it in an evening.
The course details the full rules to the strategy; when to buy, when to sell, and how much to buy and sell. But it also explains each rule in detail, so you know why it’s being used and what makes the rule important.
As a result, not only will you learn all about building a quantitative investing system, you’ll likely learn a bit about value investing along the way too.
In terms of software, the strategy is run on the simulator from Portfolio123. This is an institutional quality simulator that’s used by the likes of Merrill Lynch, Bank of America and the University of Columbia. It’s a high powered and expensive tool that costs around $300 a month to use.
However, the Marwood Value Model has been especially designed to be used without need for any expensive tools. As I show on the course, the model can be set up and run using free stock screeners that are found online.
As a result, this is a strategy that anyone can learn from, use, and enjoy.
Tell me more…
The Marwood Value Model and course is currently being prepared and will be ready in a matter of weeks. The course will flow in a similar format to my previous course on trend following.
I will be offering a special launch price to everyone on my mailing list so keep a lookout for my email when it arrives.
Pop your email in below and I will let you know when the system is ready.
Until then, have a great day. And safe value investing.


Some authors (for example, Tim Du Toit) have shown that 6-month momentum performs much better than 12-month momentum. What’s your opinion about it? Thanks in advance
I haven’t really found that to be the case. But I don’t really have an opinion as such. There are too many factors to consider.
Your Udemy is thin. Did you remove your trend and value courses?
Yes I did.