
Imagine one of the following scenarios: you inherit some money, your employer pays out a bonus, or you sell your business. Whatever the reason, you now have a significant amount of cash in your account. So, should you invest as soon as possible or wait and see?
On the one hand, you have the buy-and-hold investors. They are firmly convinced that no one can time the market. Their advice: time in the market beats market timing. That’s why it’s best to invest immediately. Stock slump? Buy! Dollar-cost averaging is their magic word.
On the other hand, you have active traders. These guys are always on the lookout for the next opportunity. Undervalued? Buy! Overvalued? Sell short! Uptrend? Buy! Downtrend? Sell!
In this piece, we want to answer the question once and for all.
- Invest immediately or wait?
- Buy when the market is falling?
- Buy only loser stocks? (not winners)
We answer these questions with comprehensive data. On the one hand, we look at global market performance since 1926. This data includes the longest bear market between 1929 and 1944 (or 1954 if you neglect dividends). We got this data from Professor K. French. We also downloaded (dividend un-adjusted) daily S&P 500 index values since 1927 from Yahoo Finance.
Additionally, we have individual stock price data since 1998, which is nearly free from survivorship bias. This includes two significant market crashes: the internet bubble and the 2007/08 financial crisis. This data is from Sharadar, which is available on Nasdaq Data Link.
Should I Stay or Should I Go?
Again, let’s assume you have some cash on the side. Should you wait, or should you invest?
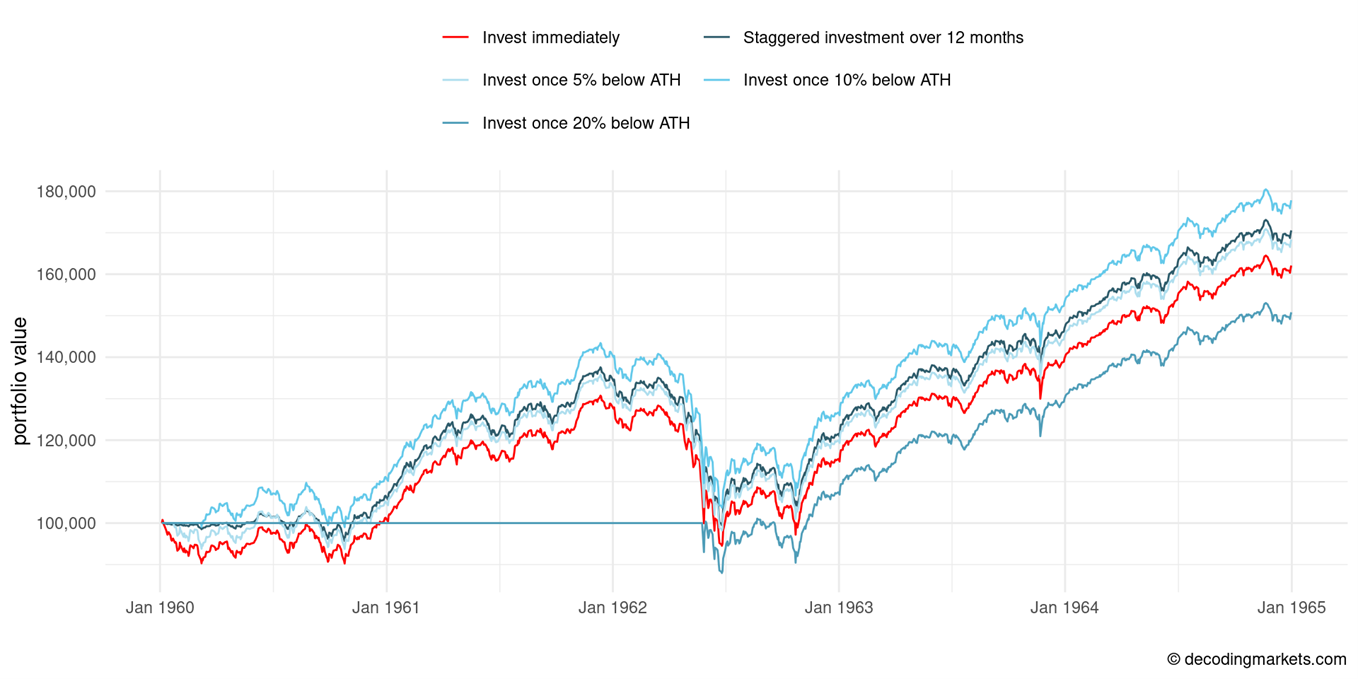
To keep things simple, let’s think of five possible strategies: (1) invest immediately, (2) staggered entry over 12 months, (3) invest once the market is at least 5% below the all-time high (“ATH”), (4) invest once at least 10% below ATH, and (5) invest once at least 20% below ATH.
Below is a chart starting in January 1960 displaying the five approaches using the daily US stock market data including dividends. By January 1965, the investor that waited for the 10%-below-ATH entry did the best (+77.8%). The second-best performance was achieved by dollar-cost averaging in a 12-month staggered entry (+70.6%). Investing immediately and being in the market for the full five years yielded +62.1%. The lowest performance was achieved by waiting for the 20%-below-ATH (+50.8%), mainly due to not having been invested for the first two and a half years.
We then simulated this starting every January since 1927 (until 2017) to determine which strategy did the best after five years. The results are relatively clear.
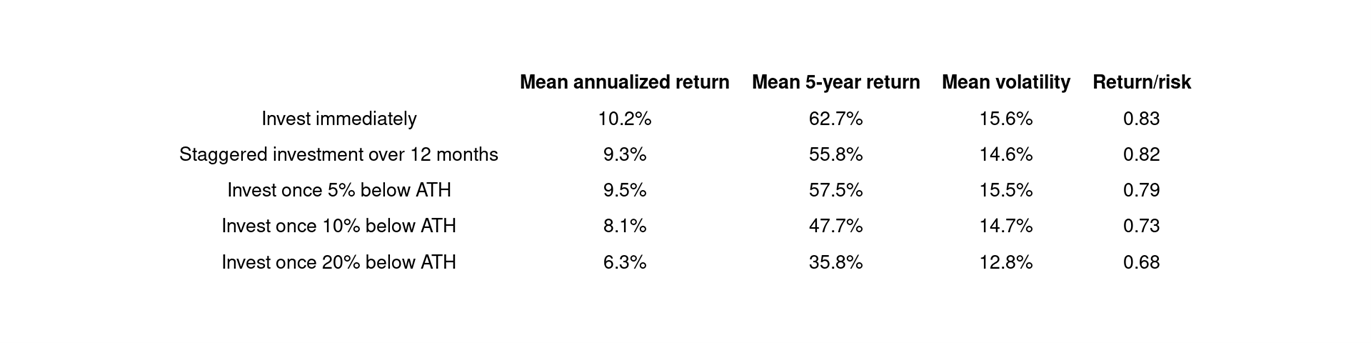
The best performance could be achieved by investing by entering the market as soon as possible (average +62.7% over five years). Dollar-cost averaging over 12 months resulted in slightly lower volatility and a lower total return (+55.8%). Waiting for a 5, 10, or 20 percent decline resulted in lower returns (as low as +35% when waiting for a 20%-below-ATH opportunity).
From this, we can conclude that, indeed, time in the market beats timing the market.
When is a Drawdown an Opportunity?
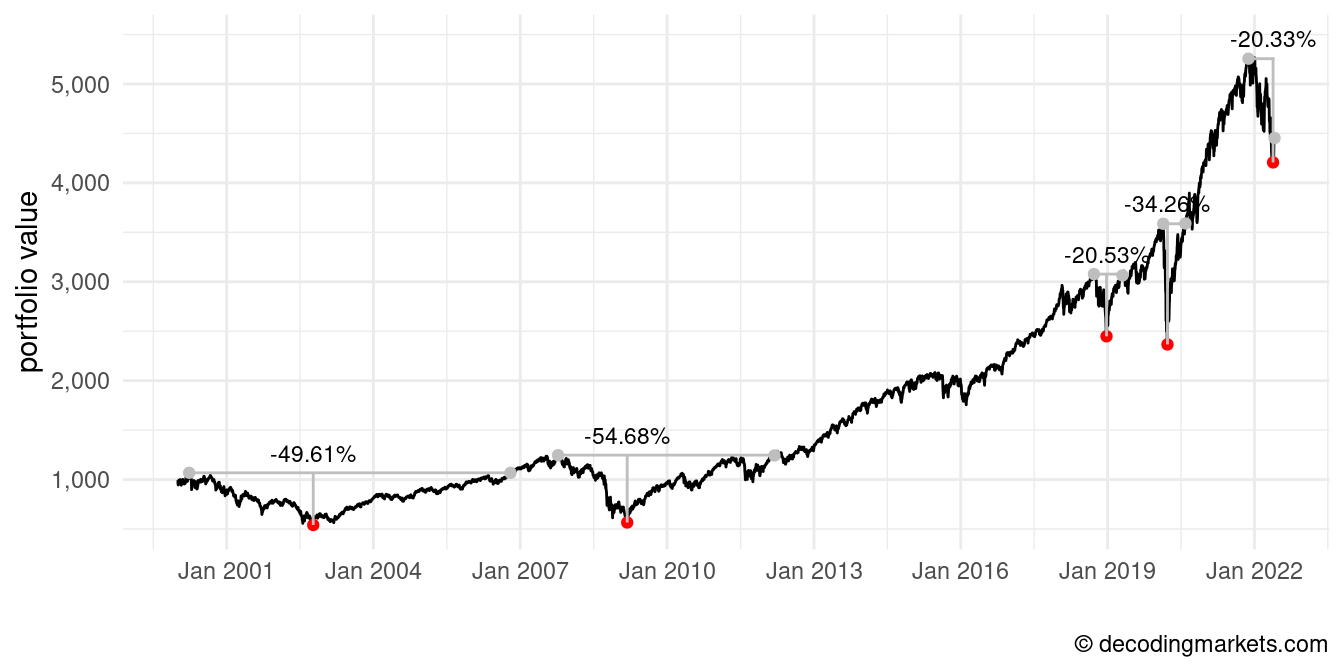
Should you buy into a collapsing market? That’s the big question that many folks want to know right now. At the time of writing this, end of June 2022, the S&P 500 index is trading about 20% below its ATH from 2021.
Since 2000 alone, we have seen five corrections of at least 20 percent below a previous ATH. Ideally, the market recovers quickly, as was the case around the 2018/19 (correction following the slowing economy and the US-China trade war) or after the 2020 crash (Covid).
However, the bear markets starting in 2000 and 2007 went considerably deeper, each destroying more than 50 percent of market value, and lasted significantly longer (6.5 and 4.5 years respectively to recover when looking at total returns).
The success of buying the dip is dependent on the market condition at the beginning of the investment. Let’s look at some summary statistics.
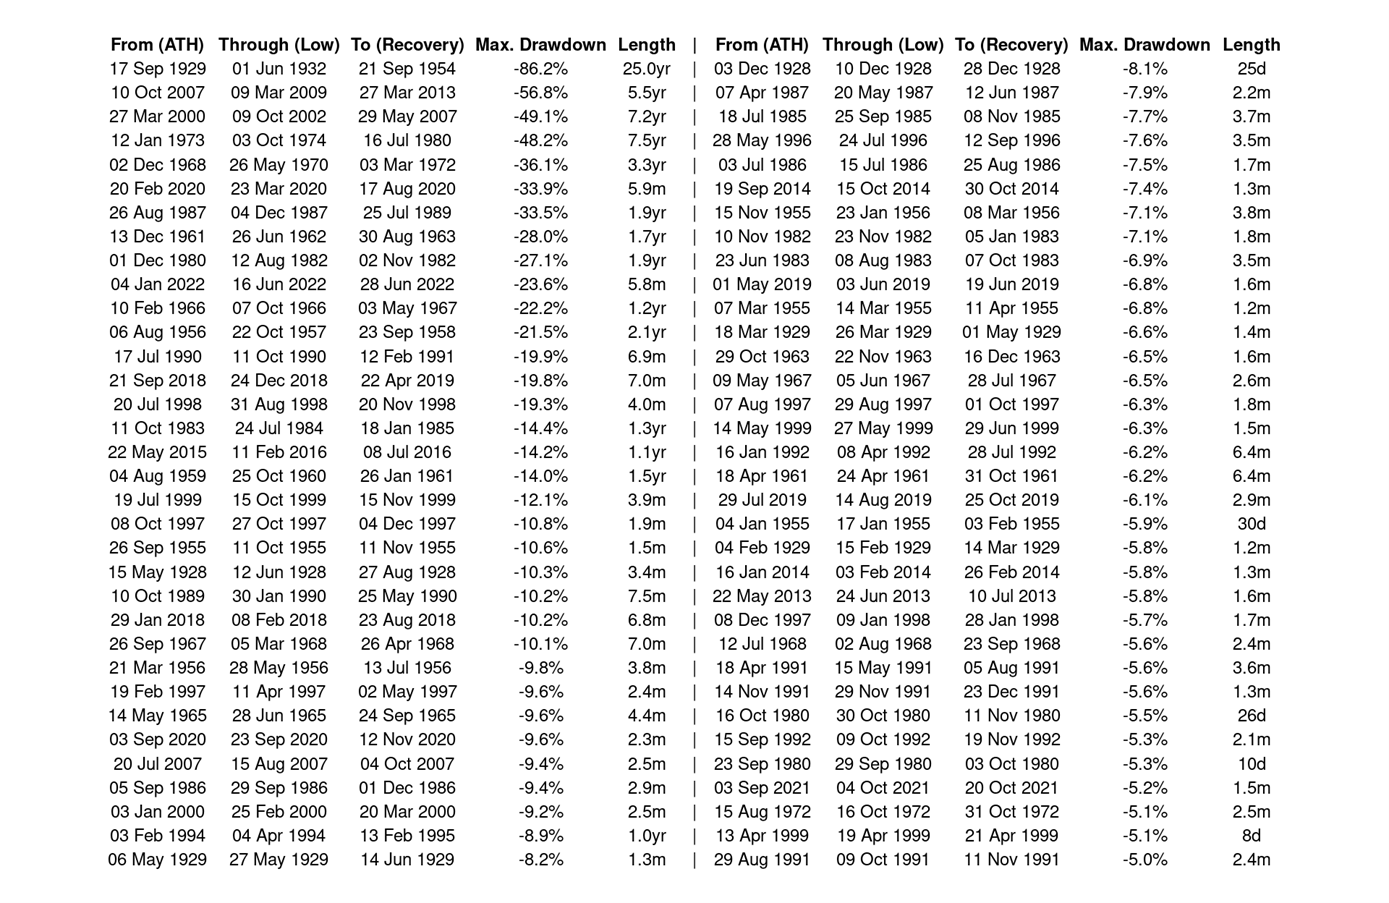
Over the last 95 years, one can count 68 drawdowns of at least -5% in the S&P 500 (not adjusted for dividends). Most (43) would not go below -10% and recover relatively fast. The average time to recover was a bit over a year. However, this is biased by how long it took to recover from the 1929 crash (25 years!). Below is the complete overview of all S&P 500 drawdowns.
Below is a histogram of the count of drawdowns with a specific maximum depth. The bin width is 5 percent. For example, we count 453 drawdowns no deeper than -5 percent, 100 drawdowns deeper than -5 but not deeper than -10 percent, etc. Very few losses of the whole market go on and turn out severely deep. The Great Depression loss was unprecedented.
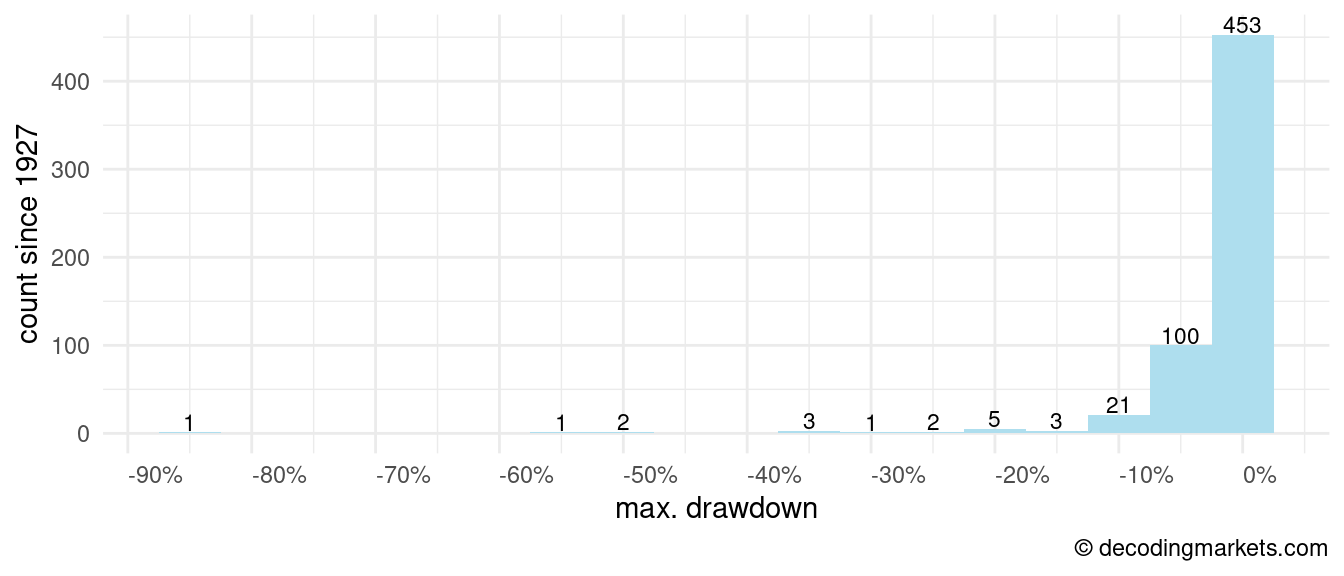
By the number of occurrences, the chances of the market recovering after a loss are considerably larger than seeing a long-lasting and severe stock market correction. In most cases, the market is going to recover. However, the market can be down for several years if it does not. It’s rare, so buying the dip will likely be the winning strategy many times in a row. But you will get badly hurt once it doesn’t work out anymore.
PE-Ratio
You can buy into a market that has fallen 10, 20, or more percent, hoping to make a bargain. But a 20 percent discount might not be enough if the market was previously overvalued by 50 percent.
One way to capture signs that the market might be overvalued is the price-to-earning (“PE”) ratio. Specifically, we look at the Shiller PE, also known as Cyclically Adjusted Price to Earnings Ratio (“CAPE”). Since 1926, the CAPE has averaged 18.7 (CAPE data is available since 1881, but we use the same start as our daily US stock market dataset).
A high CAPE can indicate an overvalued market, while a low CAPE can indicate an undervalued market.
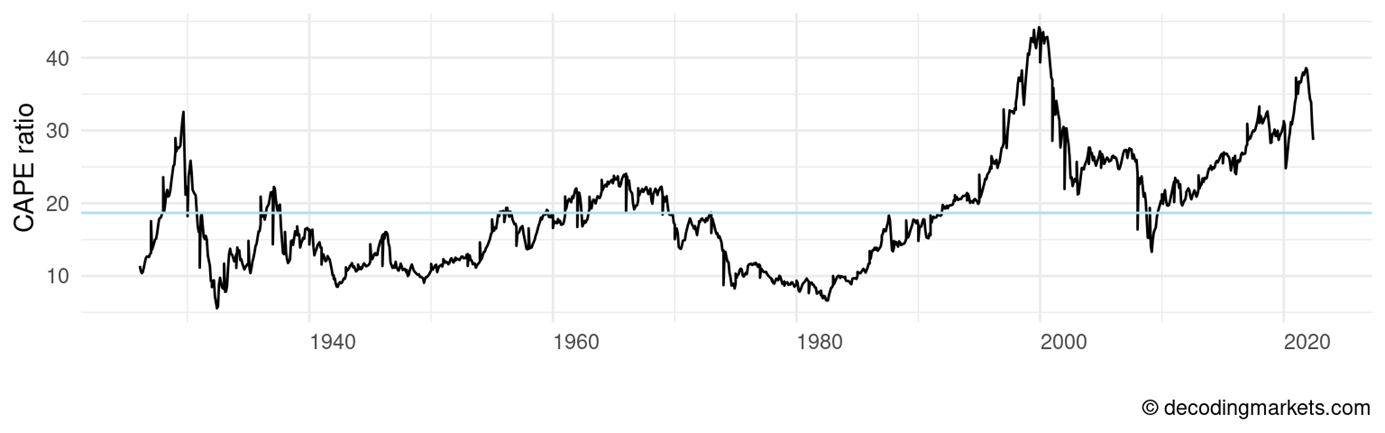
The thing with CAPE is that it can stay relatively high for several years. So going long only when CAPE is below average will cause you to stay on the sideline for a very long time.
The scatter chart below shows the CAPE ratio on the horizontal axis and the stock market performance over the following five years. The relationship is unambiguous: The highest stock market performances can all be observed following relatively low CAPEs.
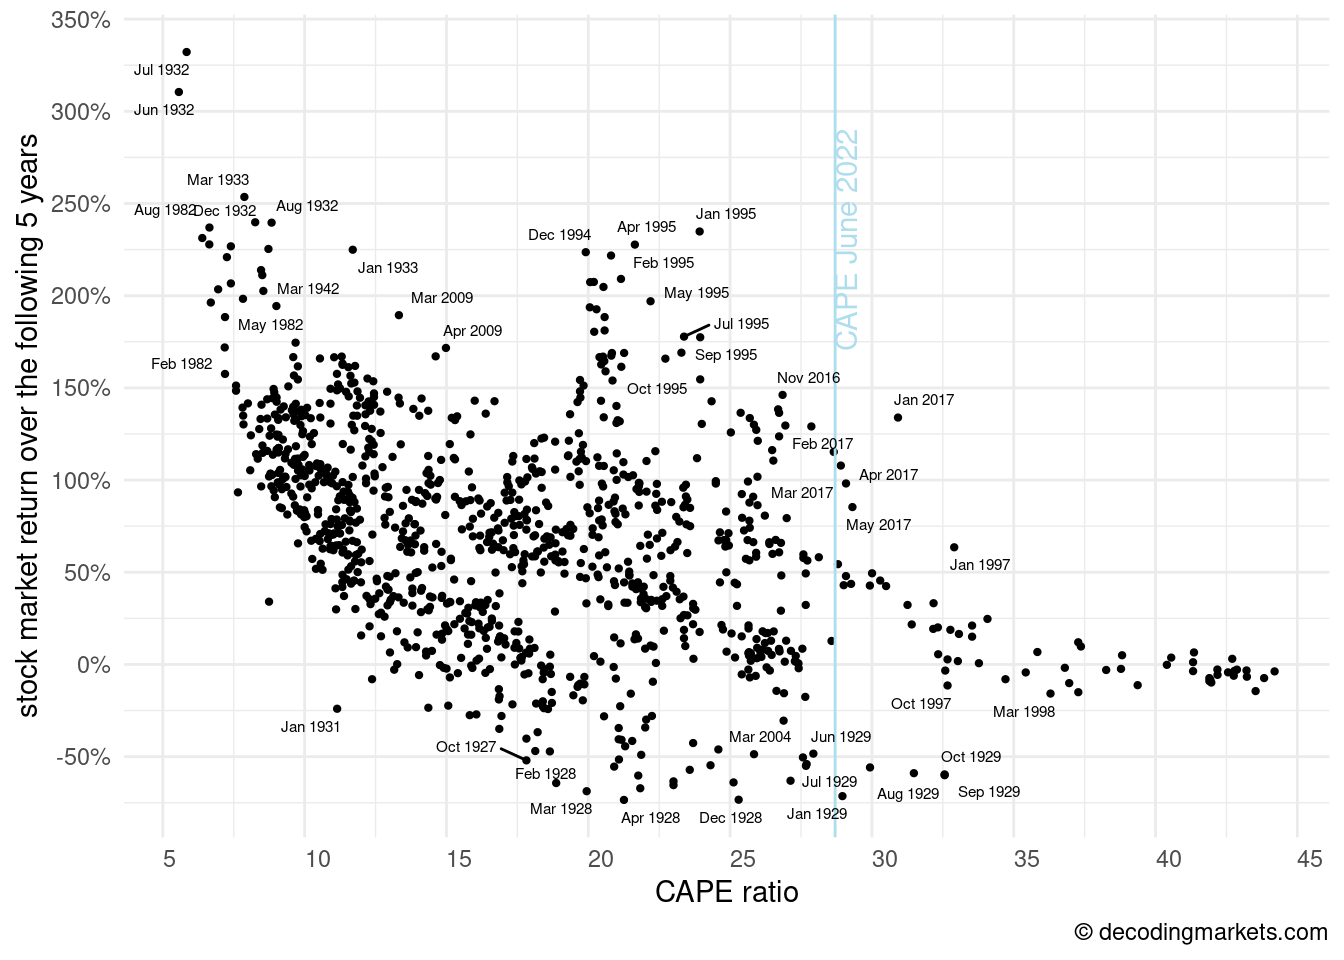
The key takeaway is that a market correction of even as much as 20 percent is not necessarily a sign of a cheap buying opportunity. It’s always intelligent to consult the CAPE. Today in June 2022, the CAPE stands at 28.7, still a relatively high figure historically.
Opportunity Hunting in a Bear Market
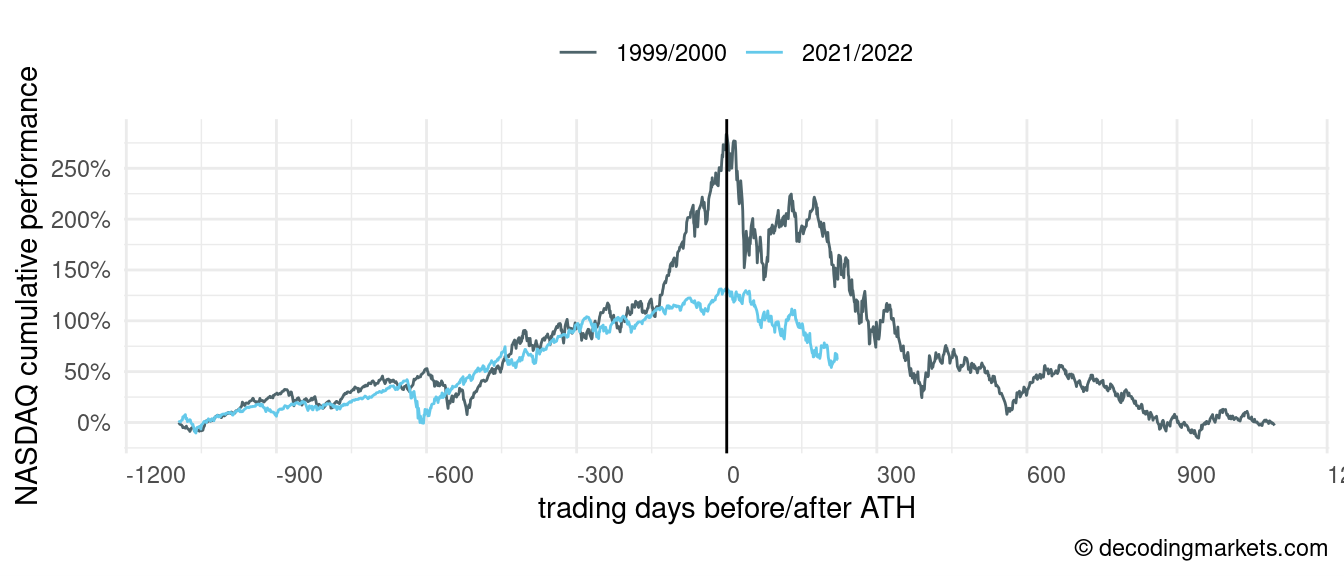
Before the Dot-Com Crash, the Nasdaq Composite peaked in March 2000. Recently, the Nasdaq hit its ATH in November 2021, after which it only went down. Of course the situation is not comparable. In the build-up of the dot-com crash, the Nasdaq more than doubled in less than a year (while it “only” gained 35% between November 2020 and November 2021).
Many other things are fundamentally different. Back in the day, the hot companies were often not much more than a glorified business plan, while today’s hot tech companies are mostly revenue-generating. Even electric vehicle makers that have not even started production have found ways of generating revenue by selling reservations.
It might very well be a completely different future we’re looking at this time. AI powered singularity might spoil us with 30 to 50 percent annual GDP growth (as predicted by Cathie Wood).
Nevertheless, let’s identify the best/worst dot-com stocks and see if investing in them would have ever been smart.
The following table shows the top-40 NASDAQ traded stocks that suffered the worst reduction in their market value over the six months following the Nasdaq’s ATH. The empty fields occur when a stock is not yet listed or had been delisted.
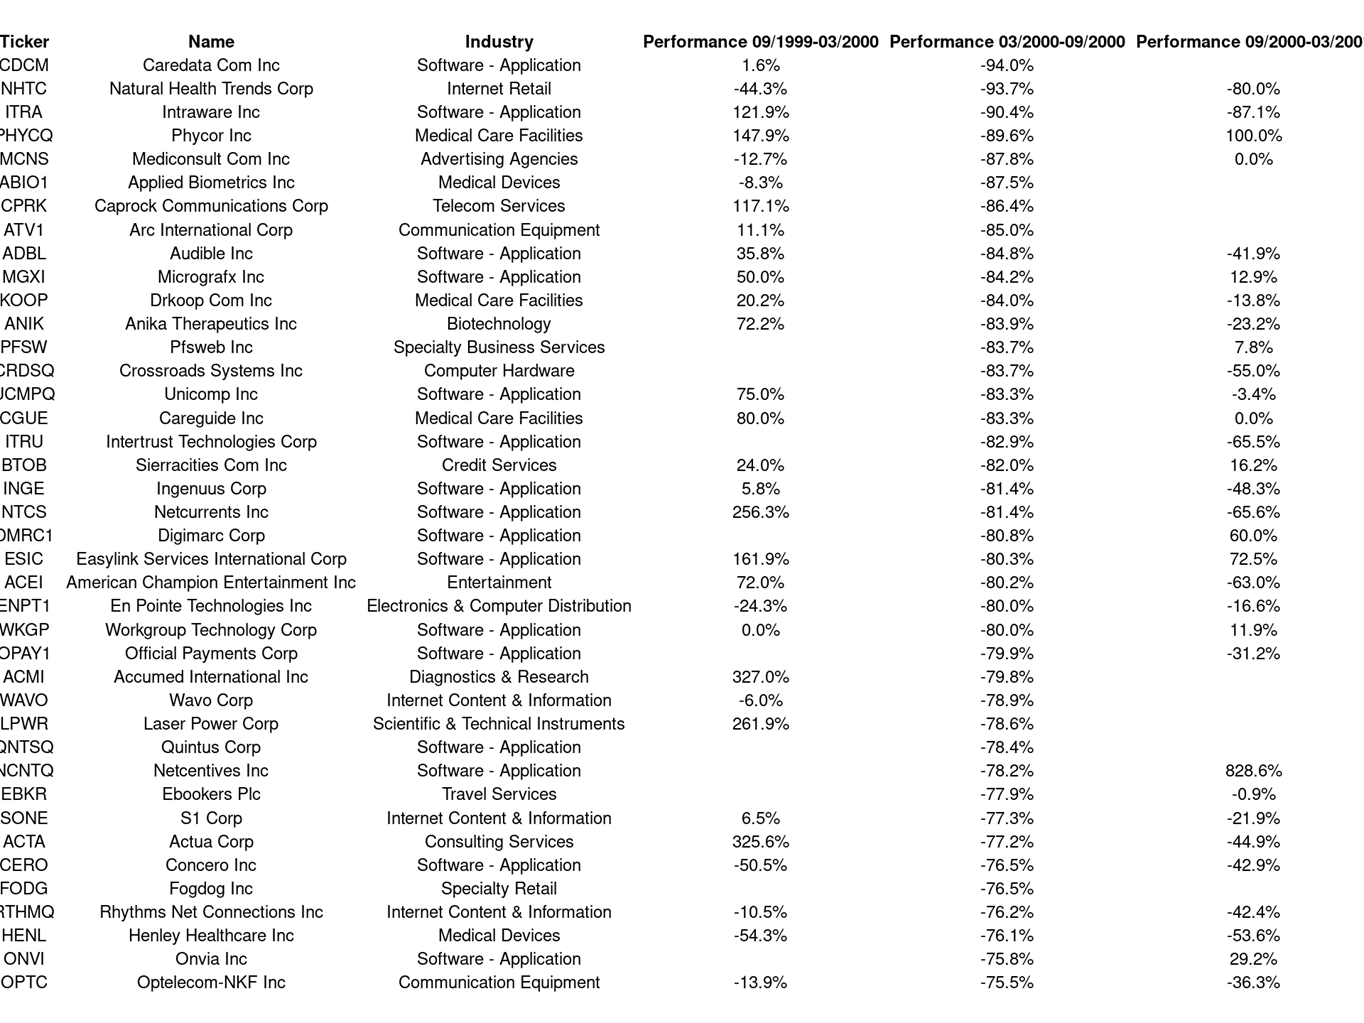
While some recovered (for example, Phycor, Digimarc, or Netcentives – all companies that further down the line filed for bankruptcy anyway), most stocks continued to drop.
We filter for stocks traded on the NASDAQ exchange and lost at least 40 percent between March 2000 and September 2000 and find a total of 467. Of these, 141 (30%) recovered or at least did not close any lower another six months in (between September 2000 and March 2001). A year later, by March 2021, only 39 could at least keep their 6-month post-crash level. 428 (92%) dropped further or got unlisted in the meantime.
Two years later, the average performance (of the ones still listed) was -53.7 percent – a dreadful statistic.
So, at least in the early 2000s, buying up the losing tech stocks after the initial crash would have turned out to be a bottomless pit. Again, we’re not saying that it’s the same today, merely that it’s something to keep in mind when assuming that companies like Tesla (currently -40%), Zoom (-79%), or Palantir (-74%) are the once in a lifetime buy-the-dip opportunities.
Will Markets Go Up Forever?
Most buy-and-hold proponents (and most academics, and most new traders that have never experienced a bear market) will tell you the same: one can expect an average return of 5 to 10 percent per year investing in stocks over the long run. The reasoning is that there’s what’s called the “equity risk premium.” If one can earn an interest for (nearly) risk-free short-term treasuries (the 3-month US T-bill currently yields about 1 percent), there must be compensation for the risk of holding stocks.
We were listening into the Twitter space discussion by the infamous pharma bro Martin Shkreli who was recently released from prison (recorded here at 1:50). He opposes this idea, claiming that there’s no compelling reason for markets to go up over the long run. Without arguing that he’s right; he does have a point.
Look at a Japan ETF (ticker EWJ) and notice that it has been trading flat since 1996. The same for the United Kingdom (EWU) since 1999 or Argentina (ARGT). There’s no intrinsic guarantee that stocks will rise.
The US (and broadly speaking, the western world) had tremendous economic growth over the past 200 years. It started with colonization, constant population growth, increased life expectancy, technological breakthroughs, etc. But looking forward to the next 200 years, it might be completely different. Our population is decreasing, while other parts of the world have much to catch up on.
Final Thoughts
Back to the initial question, we’ve discussed several ways of dip-buying. The results speak for themselves despite the hope of finding some encouraging evidence from the past.
Buying when markets have fallen (basically betting on mean reversal) is likely to be a winning strategy on most occasions. But it’s not always a good idea to wait. And if things don’t go as planned and you double down, you may be looking at long drawdowns.
Picking individual losing stocks is another way of approaching falling markets. Considering how it turned out after the Dot-Com bubble burst, buying early losers was also the wrong move.
Buying the dip is always a risky endeavor. No one knows when we’re really reaching rock bottom.