If stock picking was as simple as ticking off a few boxes it would be too easy.
However, in the book Thinking Fast and Slow, Nobel Prize winner Daniel Kahneman suggests that simple checklists and algorithms are often more effective than complex models.
Drawing on work from Meehl and Dawes, Kahneman says that checklists are most effective in low validity environments; environments such as sports prediction, business prospects, medical diagnoses, stock picking, and a whole host of other areas.
Kahneman gives one example of a wine expert who is able to predict future wine prices better than any statistical model – with an algorithm based on just three factors.
Here is a snippet from the book:
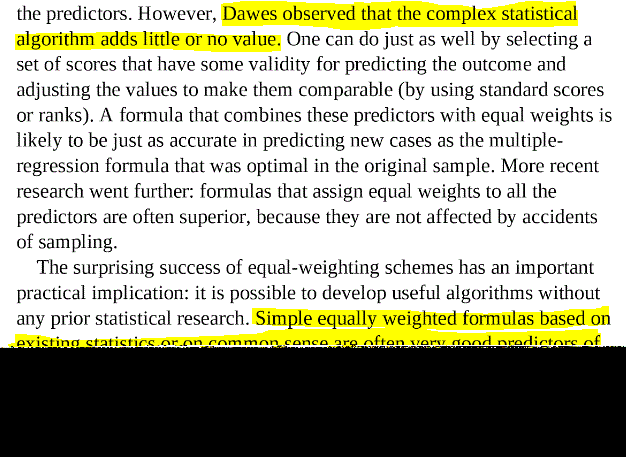
Checklists are effective because of their simplicity and because they eliminate human bias.
In the rest of this article I will discuss a checklist for swing trading stocks that I put together last year.
A Checklist For Swing Trading Small Cap Stocks
The idea is that you use a stock screener like Finviz to find stocks that fit at least 12 of the 13 points below. Only once a stock meets the criteria can you fire off a trade.
Checklist For Long Trades
- First of all – the stock must be priced between $2 and $10.
I decided on this rule after research into optimum price levels which you can see here.
- The market cap must be over $300 million and average volume over 100k
We need a way to eliminate small illiquid stocks and this seems like a good option.
- The stock fell yesterday.
Stocks tend to be mean reverting so I prefer to buy after a down day. Pretty simple.
- The recent price chart shows ‘big bars’.
Sounds a bit funny but I prefer to trade stocks that have large price candles. Some stocks enter phases of low volatility and drift away. They don’t move much and I want to avoid those.
- There is a visible/tradeable pattern.
Again, a bit subjective. But there are real patterns in charts that can be traded for profit. The key word is ‘real’.
As humans we’re programmed to see patterns even when there aren’t any. But if there’s a fundamental reason behind a chart pattern that can result in a great trade.
For example, perhaps you noticed that whenever a certain stock hits $5 it bounces. Then, you look at insider transactions and you see that the CEO keeps buying whenever the stock hits that level.
- The stock is on a key support level.
I like to buy stocks when they hit key support levels. This is a game of supply and demand after all.
Importantly, I won’t buy if the stock is only near a support level, it has to be right on it. This is where limit orders are handy.
- The stock must have a high ‘spikeability’ factor.
What are the chances of the stock spiking higher and giving us a larger than average profit? Maybe it has a low float to volume ratio. Maybe it’s in a ‘spikeable’ sector like biotech.
- The stock must have a low ‘dropability’ factor.
Another made up word. But what are the chances of the stock seeing a devastating plunge in the next few days?
You can’t predict it but you can choose to stay away from overbought stocks or stocks with binary risk events on the horizon like earnings reports.
- There must be recent insider purchases.
Recent insider purchases are a good sign, especially in the small cap space and even more so if the stock is trading at a key support level.
- Analysts are not downgrading the stock.
An analyst upgrade can help push a stock a little higher and a downgrade can hurt. For short-term swing trades, you typically want analysts on your side.
- No news scheduled in the next few days.
Sure, a big earnings beat will cause your stock to spike higher. But it could also plunge just as easily. I prefer to avoid these binary events completely. I would say this is one of the most important rules on the list.
- Weekly or monthly trend must be up.
If you want to go long, it’s better to have the prevailing wind behind you.
- There are more lower shadows than upper shadows.
Lower shadows occur when price hits a new low and rejects it. Upper shadows occur when price hits a new high and rejects it.
Thus, if there are more lower shadows than upper shadows, it suggests the stock is finding support at those levels. It is not an exact science but it is something to consider.
Putting It Together
Here is the full list again:
- Stock must be priced between $2 and $10.
- Market cap must be over $300 million and average volume over 100k
- Stock fell yesterday.
- Recent price chart shows ‘big bars’.
- There is a visible/tradeable pattern.
- The stock is on a key support level.
- The stock must have a high ‘spikeability’ factor.
- The stock must have a low ‘dropability’ factor.
- There must be recent insider purchases.
- Analysts are not downgrading the stock.
- No news scheduled in the next few days.
- Weekly or monthly trend must be up.
- There are more lower shadows than upper shadows.
So that’s the checklist for finding potential long trades in small cap stocks. The idea is that the stock needs to tick 12 of the 13 boxes or you can’t enter the trade.
I trialed this approach last year with a demo account and did OK with it.
Of course, you’ll need a rule for risk and for exiting trades as well.
One option would be to sell when the stock no longer meets, say, five of the rules. However, I’ve found that a time-based exit works well – such as selling after 5-10 days.
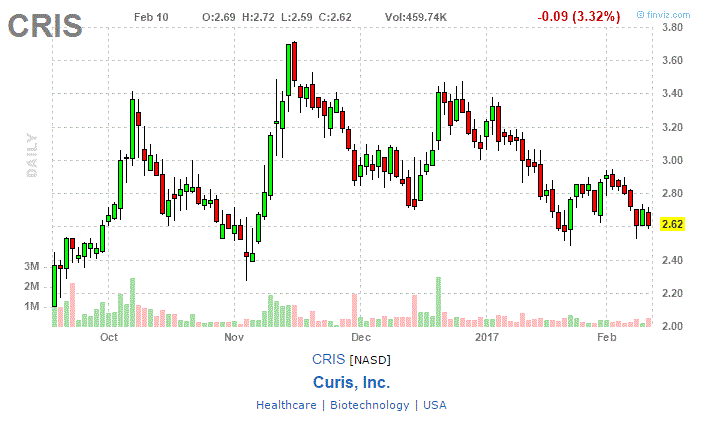
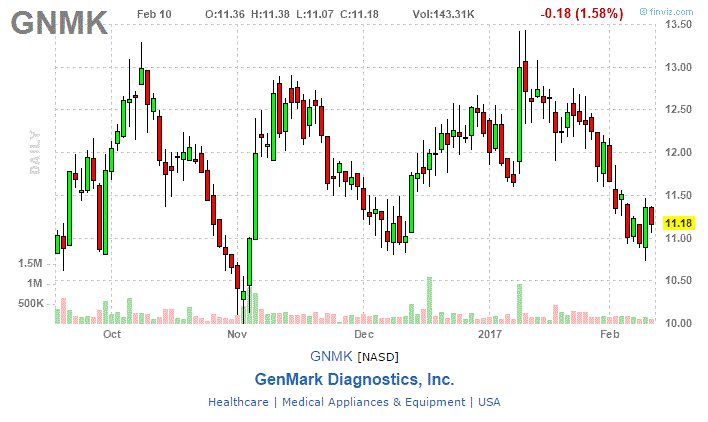
Example Long Setups
Using this checklist to pick swing trades is surprisingly quick and can be done in less than half an hour with a stock screener like Finviz.
If you enter rules 1, 2 and 3 into the screener you’ll typically be left with around 100 charts that you can skim through to find potential setups.
Then you can drill down into them to see if they match the other rules on the list like recent insider purchases.
Finding Shorts
To find short picks I simply reversed the rules and made a few adjustments. I did try this on a demo account and I found that it worked pretty well on the whole.
Here are the rules for shorts:
- Price is between $5 and $20.
Again, this is based on my own research and experience. I don’t like shorting stocks under $5 unless for a major fundamental reason.
- The market cap must be over $300 million and average volume over $100k
- The stock went up yesterday.
- The stock has ‘big bars’.
- There is a visible/tradeable pattern.
- The stock is on a key resistance level.
- The stock has a low ‘spikeability’ factor.
Perhaps the stock already spiked up recently. Perhaps volume peaked already.
- The stock has a high ‘dropability’ factor.
Perhaps the stock is in a highly speculative industry such as biotech or gold mining. Perhaps recent news or price moves are an over-reaction.
- There is a good chance of profit-taking.
I find this to be one of the most important rules for the short side. Is there a solid reason for traders to book some profits at the price level?
- There is recent insider selling.
Insider sales are less significant than purchases but they are still a useful indicator.
- There is recent analyst downgrades.
Recent analyst downgrades can give more reason for investors to dump their stock.
- There is no news scheduled.
As mentioned above, I prefer to avoid binary events like earnings.
- The weekly or monthly chart is trending down.
- There are more upper shadows than lower shadows.
You will find that this checklist has one extra rule than the long checklist. Because of this, I like to loosen the criteria and take shorts if they match 12 out of the 14 rules.
Putting It Together
- Price is between $5 and $20.
- Market cap must be over $300 million and average volume over $100k
- The stock went up yesterday.
- The stock has ‘big bars’.
- There is a visible/tradeable pattern.
- The stock is on a key resistance level.
- The stock has a low ‘spikeability’ factor.
- The stock has a high ‘dropability’ factor.
- There is a good chance of profit-taking.
- There is recent insider selling.
- There is recent analyst downgrades.
- There is no news scheduled.
- The weekly or monthly chart is trending down.
- There are more upper shadows than lower shadows.
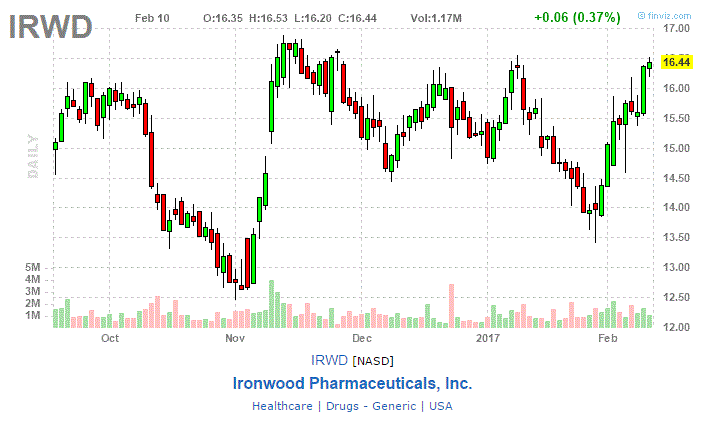
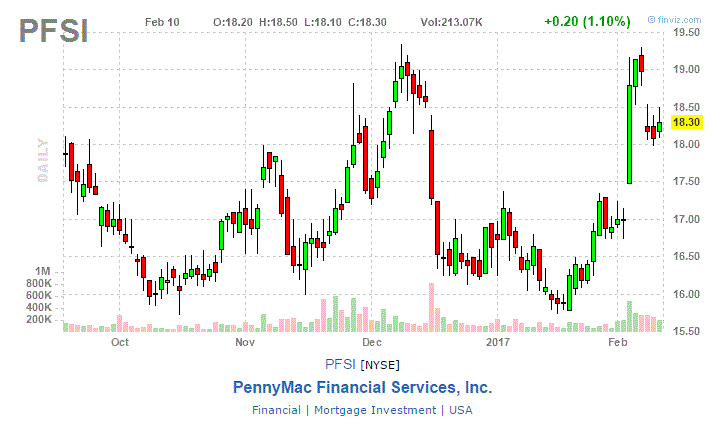
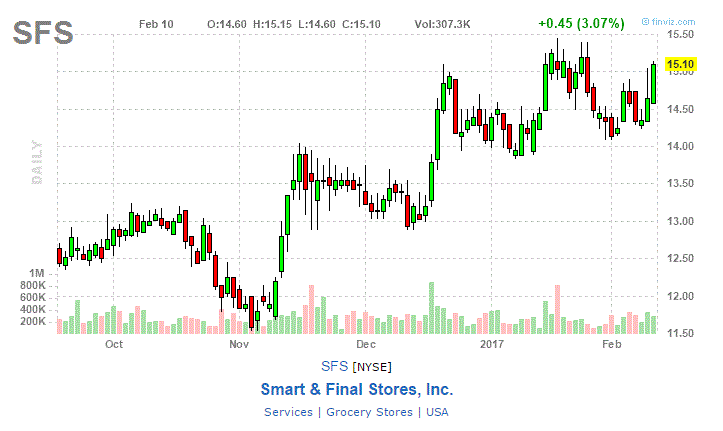
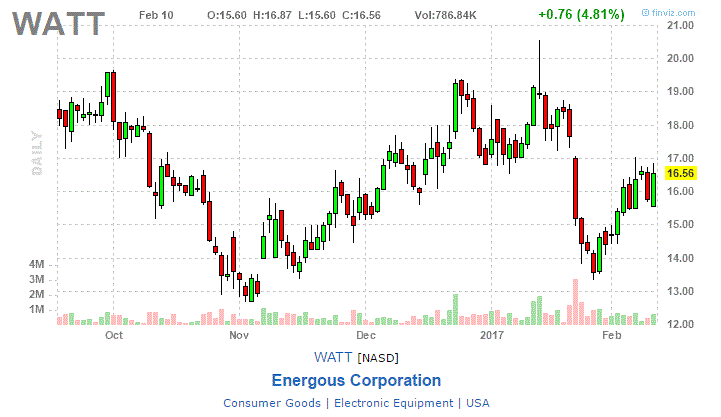
Example Short Setups

How To Approach Checklist Trading
The disadvantage of using a checklist to trade is that you have no historical evidence that your setups will work and that is one of the main reasons why I prefer the back-testing approach.
Putting all of the rules above into code ready for back-testing would be impossible.
The best approach, therefore, is to start trading any checklist that you make very cautiously and build up confidence as you go. As I mentioned in this roadmap to trading success, it is essential to keep track of your trades and analyse them constantly.
As your sample size increases you will be in a position to decide whether or not the strategy is working.
What About Fundamentals And Financial Ratios?
You can see that the checklist rules above pay very little attention to fundamentals like cash flow or financial ratios such as ROE (return on equity) or PE (price to earnings).
The reason is simple. Over the short-term I find that these values have very little predictive ability.
You would think that adding a rule to buy low PE stocks and short high PE stocks would make perfect sense. But I have found that this simply isn’t the case on short time frames.
In fact, I’ve found that high PE stocks can do better over the short-term and low PE stocks can do worse because they are often value traps or stocks caught in a downward spiral.
Even so, there could be some financial ratios that are useful for a checklist approach. For example, I know that William J. O’Neill has rules for picking stocks with the best quarterly or annual earnings growth – shown in the classic book How to Make Money In Stocks.
What About Longer-Term Investing?
For longer-term time frames, however, I absolutely think that fundamentals and financial ratios are useful.
Low PE ratios in particular are surely correlated to higher annual returns as pointed out by Professor Shiller and as alluded to by Ben Graham and Warren Buffett.
James O’Shaughnessy also showed this very well in the book What Works On Wall Street and I have developed two strategies, the Marwood Value Model and Income Grower that use financial ratios as a basis for stock selection.
The Marwood Value Model, for example, picks stocks when a selection of financial ratios (such as P/E, P/B, P/S, P/FCF) are all under 10 and it shows a fantastic return in back-testing.
At some point, I will return to this topic and look at what other checklists might work in the stock market.
Final Conclusions
In this article I detailed a checklist approach for finding swing trades in small cap stocks. Now that I have put it together I can see that it is probably too subjective to fit Kahneman’s definition of a checklist.
It still relies a lot on my own chart reading/intuition. Even so, I think it is still useful since it has worked pretty reasonably for me over a short period.
For now, I would love to hear what your thoughts are and if you use any checklists of your own?

Great article Joe! This is an awesome resource for anyone trading small cap stocks. I especially appreciate the emphasis on checklists as a way to systematize the idea finding and trade decision-making process. To Kahneman’s point, it’s been my experience too that following a define process leads to more consistent results than shooting from the hip (by a long shot!) Cheers!
Excellent Article. I love every bit of it. Thank you for simplifying a great checklist. I’m still deciding between intraday trading and swing trading and this could be the deciding factor in my decision. Thank you