In this article we will look at a simple trade setup that has been backtested on US stocks and shown to be profitable over nearly 20 years of historical data.
We will then consider the benefits and risks of this setup and whether it might be possible to improve the setup with additional analysis.
An alternate version of this strategy with full code is included in Marwood Research.
The Setup
Regular readers will know that I prefer simple trading rules over more elaborate ones for the simple reason that they are harder to curve fit.
As the number of rules increases, the number of possible setup permutations increases exponentially and so does the chance of overfitting.
Simple trade setups are also good because they generate a larger sample of trade ideas and these can be better combined with additional analysis.
The rules of this trade setup are shown below:
Buy Rules
- Weekly close is above 10-week MA
- AND turnover crosses 1.5 x the 10-week average turnover
- AND 10-week turnover > $500,000
Sell Rules
- Sell by 25% trailing stop
Additional Settings
- Stock is a member of the S&P 1500 Universe
- All trades executed on next weekly open
- Position size: fixed $500 per trade
Trade Rationale
The rationale behind this trade setup is very simple. We want to buy a stock that is experiencing a surge in trading volume (represented here by dollar turnover which is the close price * volume) that is also in an upward trend. Then we want to use a trailing stop to minimize risk and capture upside.
Example Trade Setup
Following is an example of the trade setup we are looking for in EHTH:
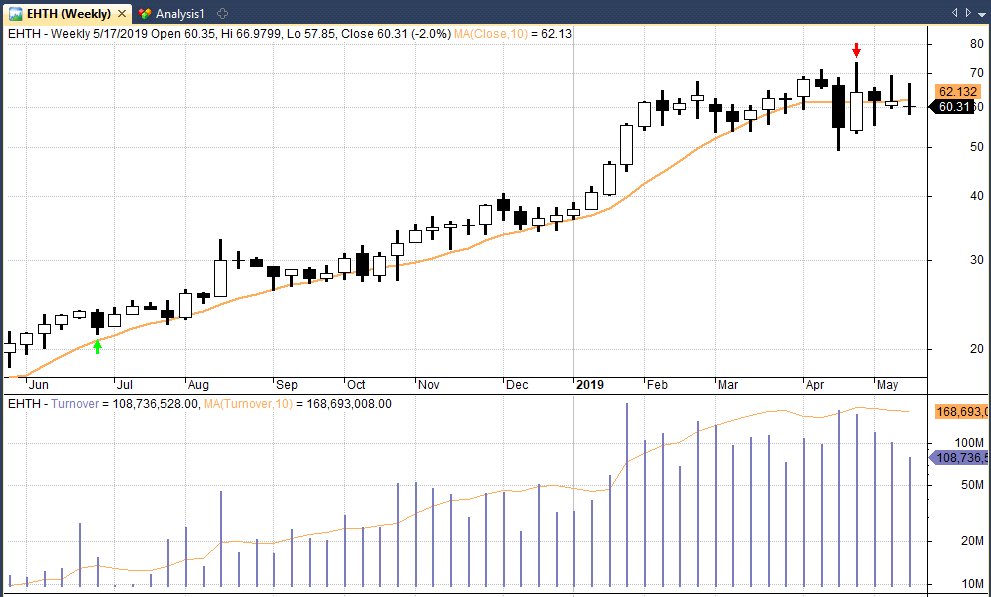
You may see that the stock is trading above its 10-week MA (orange line) on the week of 6/22/18. Turnover also crosses above 1.5 times the 10-week average (bottom pane).
We therefore go long on the next week open at a price of $23.71 shown by the green arrow. The stock continues on a long upward trend for 44 weeks.
We exit the trade on 4/26/2019 (red arrow) after the trailing stop is taken out in the prior week for a total profit of 127.88% before fees.
Backtest Results
Now we know the rules of this setup we can backtest it on our historical database of stocks.
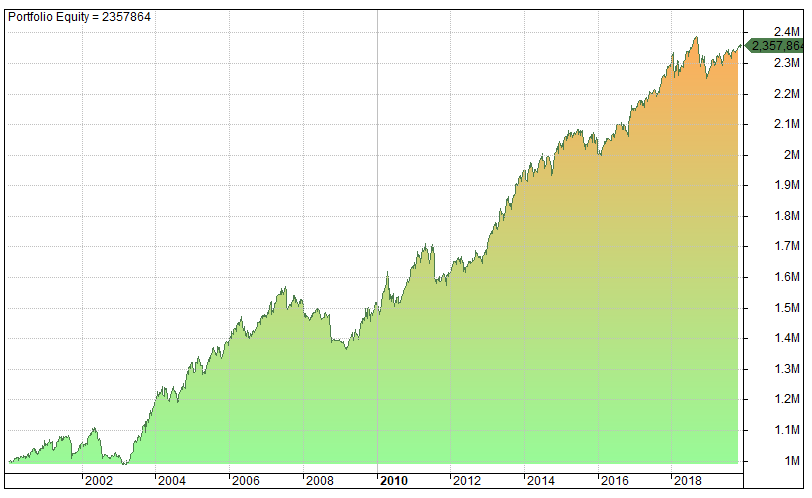
Testing this setup on all S&P 1500 stocks (including historical members and delisted stocks) between January 2000 and December 2019 we get the following statistics and equity curve:
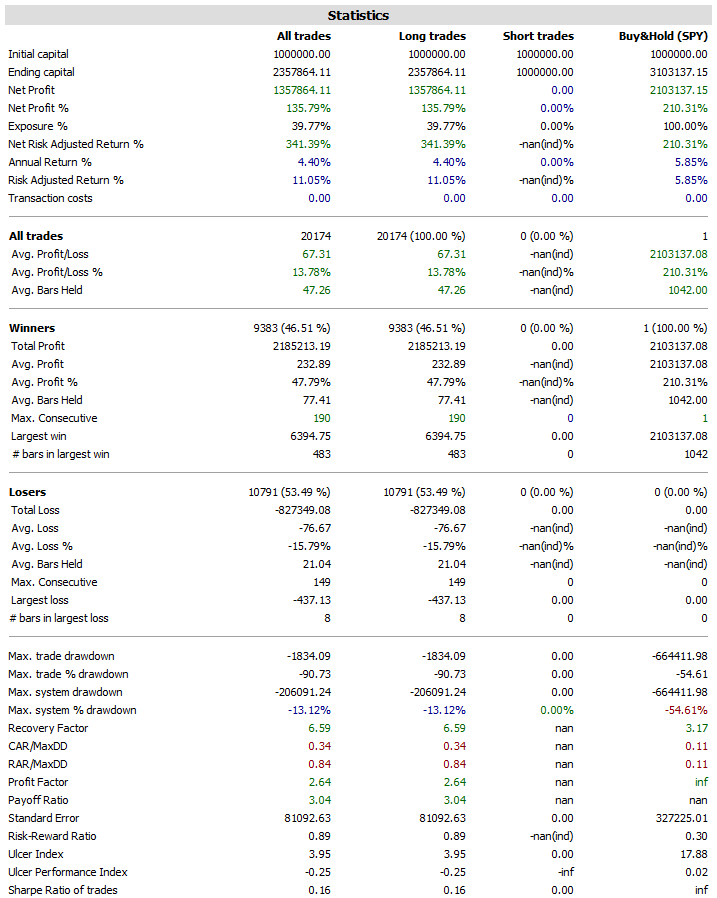
As you can see from these results, this has been a profitable trade setup over the last 19 years.
The average profit per trade is good at 13.78% and more than enough to cover trading costs.
The win rate at 46.51% is reasonable and what you might expect for this type of trend strategy.
The profit factor is decent at 2.64 and the payoff ratio is strong at 3.04 which implies the setup could be a candidate for more aggressive position sizing.
Also, the equity curve is smooth and sloping upwards showing a profitable timeline for this strategy:
Importantly, these results are based on a large sample of 20,174 trades which gives extra credibility to these results.
Consideration Of Risks
Although these trade results look good on paper there are still risks that we need to consider before transitioning to a live trading environment.
The number one risk is that these trade results may be curve fit or may stop working in future market conditions.
This risk will always be present but we have tried to reduce this risk by using minimal rules and having a large sample of trades. The strategy also benefits from the fact that it trades with the market at it’s back. It does not try to short stocks in up trends.
Another risk with this strategy is that it could under-perform in a flat or bear market. The bull market cannot continue forever but our moving average rule should negate some of this risk.
Overall, the risks are reasonable for this strategy due to the medium term nature of the setup and the fact it has been profitable over so many trades.
Is this a setup that will make you rich in a short time?
Probably not. But it could be worth investigating further and trying different methods to improve results.
Combining Analysis To Improve Performance
As system traders, we operate in a world defined by the data we have access to. This is usually price and volume data and less frequently fundamental and alternative data.
This causes problems because the world cannot be simplified or modeled accurately with such limited data-sets.
Even detailed fundamental statistics (if they were available) would not be enough to accurately model future stock prices due to the inability of anyone to predict future trends or earnings.
There are two main solutions for systematic traders:
- Combine multiple trading signals together thereby increasing the frequency of trades and improving the likelihood of achieving an overall model that does resemble some form of reality (which therefore results in profitable trades).
- Combine qualitative analysis and intuition to fine tune a trading setup and produce trade decisions that include more real world variables.
The Role Of Intuition
It’s my view that a simple trade setup like the one shown here should be considered as a base for developing a more nuanced trading strategy, one that is better able to incorporate real life variables.
That way you have the opportunity to outperform the model but also the fail-safe of a statistical edge.
For example, let’s say you run the model and it spits out signals for 10 new positions.
One option is to take all the positions with an equal weighting and let the law of large numbers prevail.
A second option is to look at each signal and consider which ones are more likely to be profitable given your experience and knowledge of real world, qualitative variables.
By this I mean variables such as price-to-earnings, expected growth rate, sentiment, upcoming events and narrative.
Most of these variables cannot be backtested reliably. But there is no doubt they have a big impact on the movement of stock prices and therefore should be considered.
Let Your Intuition Speak
Nobel prize winning psychologist Danny Kahneman recommends only using intuition after you have gathered as much important information as possible.
So think about what are the most likely factors that could impact the price of any stock that is spat out by the model and do that extra research.
Kahneman says once you have all the information you can gather, close your eyes and let your intuition speak. Then give that intuition a weighting, perhaps as high as 50%. Kahneman reports that doing so can greatly enhance decision making in a number of different areas.
In my view, intuition can have value for system traders but it takes practice and experience to bring it out. Until you have that experience it’s better to stick to a tried and tested model.
I wonder what the impact of bypassing a buy signal when a stock has already risen x% in the last y weeks would be. Or perhaps a better measure would be if RSI(14) was above a certain level at the close of the bar that meets all of your other stated criteria.