If you are anything like me, you probably like to keep up to date with new technology, watch for new trends and generally keep abreast of anything that might lead to profitable trading opportunities. With that in mind, last week I did a bit of research on trading stocks with Google Trends and was quite surprised at what I found.
Trading stocks with Google Trends isn’t easy
The first thing that caught my attention is that there isn’t actually a great deal of information available about using Google to trade. (Which is hardly surprising really since Google Trends is relatively new and most search data only goes back to around 2004.)
The most interesting article I could find comes from a paper by the Nature Scientific Report entitled ‘Quantifying Trading Behaviour in Financial Markets Using Google Trends’ written by the economists Tobias Preis, Helen Susannah and H. Eugene Stanley.
In the paper, the economists analyse Google search data for 98 different finance related search terms between 2004 to 2011 and appear to come up with a near foolproof strategy that was shown to yield a return of 326% over the time frame.
How it works
The idea behind the study is simple. The three economists took data from Google Trends and entered long or short positions whenever there was a spike in their chosen keyword. Some keywords performed better than others and some had no effect whatsoever.
The keyword ‘debt’ was the best predictor of returns
It was found that the search term ‘debt’ was the most effective in predicting market moves. Preis et al therefore used the data to enter long or short positions in the Dow Jones Industrial Average.
Whenever Google searches for the keyword ‘debt’ increased, Preis et al entered hypothetical short positions in the main index for one week. Conversely, whenever searches for ‘debt’ decreased, the economists went long for one week.
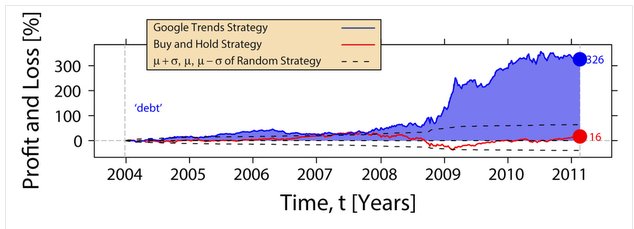
Trading in this way, the strategy was shown to make a return of 326% while a buy and hold strategy on the Dow would have made just 16%.
An example of curve fitting?
The problem with this study, in my mind, is that is a clear example of curve fitting to past data. By choosing the best keyword, the writers are using the best parameter from the hypothetical results. There is no testing on out of sample data which means they have broken one of the first rules of system optimization.
Furthermore, since we all know that the global financial crisis stemmed from a problem of bad credit, we already know that the word ‘debt’ is likely to be a big predictor of major moves.
We have all lived through the the financial crisis so we all know about those massive declines in the Dow. And as the chart below shows, it is during the crisis that most profits were made.
Source: Scientific Nature Report
This study suggests that going forward, using the keyword ‘debt’ will produce similar returns but I find this very unlikely.
Just as we could not know that ‘debt’ would be so paramount to financial markets between 2004-11, we will not know what search terms will be considered important over the next time periods. Shorting stocks because the word ‘debt’ is searched more frequently seems dangerous. Indeed, the term has spiked twice since 2011, yet the Dow Jones has gone on to record highs.
Conclusion
Overall, I think we can thank the authors for this study as it has given us some interesting insights. However, to trade using this strategy could be deeply flawed. The only way to tell is by running it over clean, future data. The future is never known and I doubt that this strategy will stand up over time.
In part two I will look at more ways of incorporating Google Trends into stock trading systems.

