A reader asked about trading divergence so I thought I would look into it. Searching the web I found many articles that claim divergence trading is an effective way to trade stocks. However, there is very little empirical evidence provided.
In this article we test several different divergence strategies and we compare our results to a benchmark to see if there is any edge available.
Benchmark Results
Our test universe for this analysis will be all S&P 500 stocks which are over $2 and with an average turnover over $250,000. This data is provided by Norgate and includes delisted companies.
The average 3-day, 5-day and 10-day returns for all S&P 500 stocks between 1/2000 – 1/2018 are shown below:

So the average 3-day return for a short signal on S&P 500 stocks is -0.11% and the average 10-day return for a long trade is 0.39%.
Now we know what the average daily returns are for these stocks we can run our divergence strategies and compare our results to these benchmark numbers.
#1. RSI Divergence Trading Strategy
The most common method used to trade divergence is to use the RSI indicator.
When price makes a new low but RSI doesn’t, it signals divergence in the price trend so traders take that as a bullish signal.
Similarly, when price makes a new high but RSI doesn’t, it’s considered bearish.
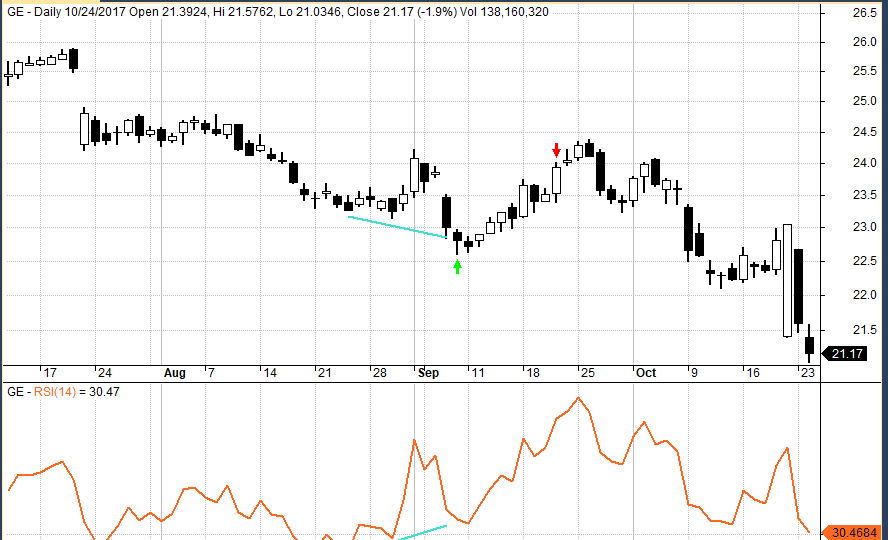
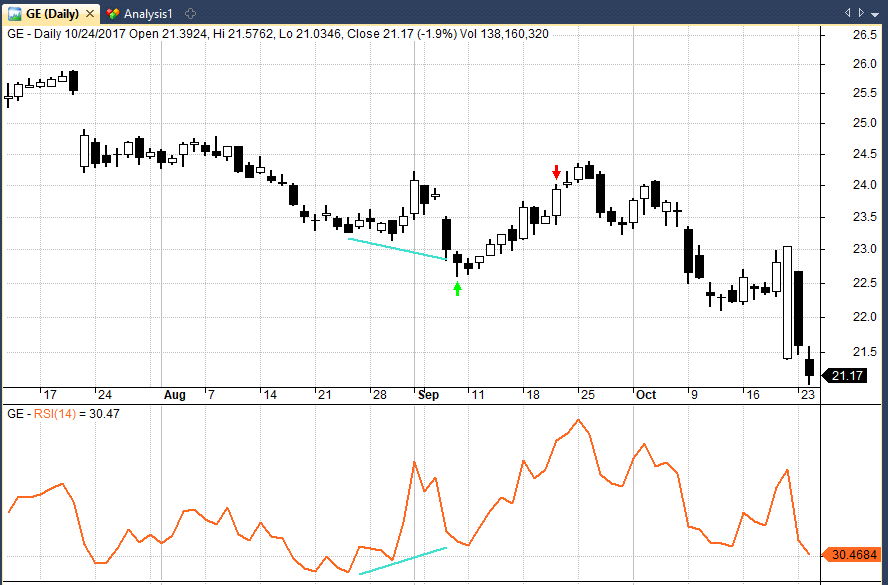
In the next chart you can see that GE made a new 10-day low in September 2017 but RSI was moving higher. This signal preceded a decent rally:

Using Amibroker software we can test this signal and compare our results to the benchmark figures we obtained earlier.
The following table shows the results from going long or short after an RSI divergence signal:
(Longs are taken when price hits a new 10-day low but RSI(14) doesn’t. Shorts are taken when price hits a new 10-day high but RSI(14) doesn’t.)

You can see from the table above that our best result came from going long an RSI divergence and holding for 10-days.
Going long when price hits a new 10-day low but RSI(14) doesn’t produced an average profit per trade of 0.97% and a win rate of 56.38%. This was much better than the benchmark 10-day return of 0.39%.
Looking at the short divergence signals you can see that they were all unprofitable although they all lost less than the benchmark returns.
#2. Stochastics Divergence Trading Strategy
A second way to trade divergence is using the Stochastics indicator.
Stochastics is another momentum oscillator that measures the strength of the trend by comparing the position of the close of each candle to the high and low of each candle.
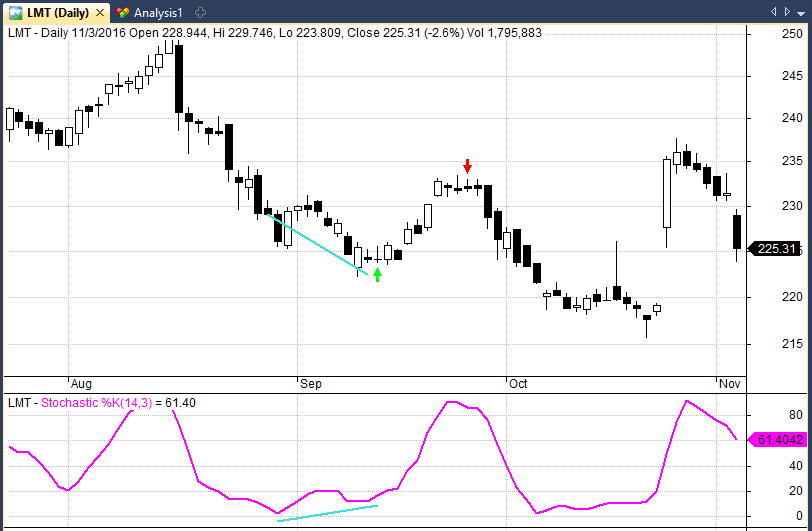
In this test, we will use Stochastics %K and take longs when price hits a new 10-day low but Stochastics %K doesn’t make a new low.

We will take shorts when price hits a new 10-day high but Stochastics %K doesn’t make a new high. The following table shows our simulation results:

As you can see from the table above, our best result came from a 10-day holding period where we recorded an average profit of 0.57% and a win rate of 55%.
This was better than the benchmark return of 0.39% but it wasn’t as good as the result for RSI.
Once again, the short signals were all unprofitable.
#3. Rate of Change Divergence Trading Strategy
A third way to trade divergence is with the Rate of Change indicator (ROC). ROC is a pure momentum oscillator that measures the percentage change in price from one period to another.
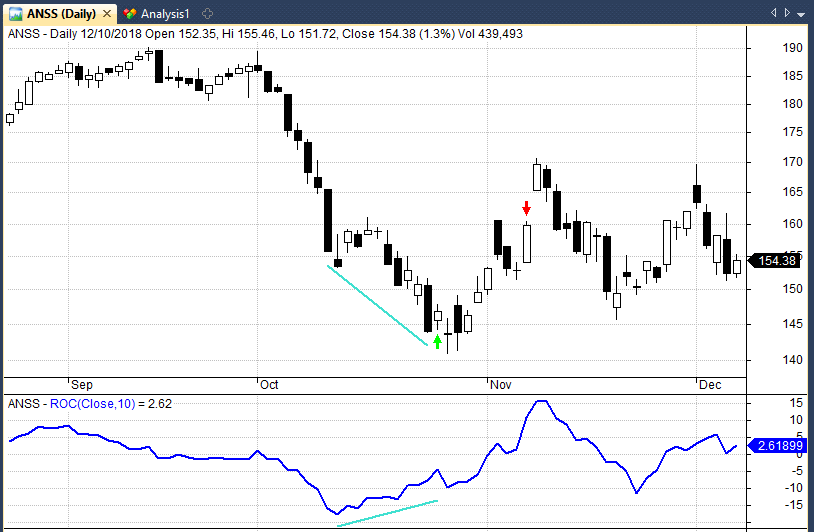
In this analysis, we will take longs when price hits a new 10-day low but ROC(10) doesn’t make a new low.

We will take shorts when price hits a new 10-day high but ROC(10) doesn’t make a new high:

Once again, our best result came from going long with a 10-day holding period where we recorded an average profit per trade of 0.69%. This was better than the benchmark return of 0.39%.
Once again, all our losing signals were unprofitable but they were all better than the benchmark result. This indicates there may be some very weak signal in the pattern.
Is There A Signal In The Noise?
The results from these tests on divergence are disappointing, especially for short trades and for holding periods of three and five days.
Once transactions costs are included you can expect that these results will decline further.
The fact that profits increase as trade duration increases suggests that a good portion of the profit comes from the underlying trend (i.e. the upward drift of the market) and not the signal itself.
The best result we found was RSI divergence with a 10-day holding period which produced an average return of 0.97% per trade.
However, none of the strategies tested show a significant edge and this supports other analysis I have done in the past on divergence.
There may be some signal coming from the RSI divergence trading strategy, however, it is weak and unlikely to be a worthwhile strategy on its own.
It could be worth exploring further since it is possible to improve an overall strategy by combining weak signals with other stronger signals. (The sum can be stronger than the parts).
However, there are likely more profitable signals that we can look at since these divergence signals are not very strong on their own.

Really solid testing. Thanks for sharing.
I feel like most of the edge lies in data. As long as we only look at the price of our asset and nothing else, there’s very little edge left to find. Technical analysis and most trading truths are useless nowadays, if not combined with outside data.
Technical patterns can still be profitable but agree with what you’re saying. Combining new data sources is what I will be looking at more closely going forward.
How about measuring relative returns vs. index?
would it be worthwhile?
I’ve had better results with Hidden Divergence. Ex.: A stock in an uptrend makes a higher low, but the indicator makes a lower low. This basically means you are entering on pullbacks in a trend. This type of divergence shows you when a pullback is relatively over-stretched and likely to snap back. I like to use the RSI 14 and CCI 10. Unfortunately, I don’t have the programming skills to test these setups, perhaps you could?
If you could please provide a clearer definition of the rule then I can test it, cheers
the concept of divergence and the charts you show, do not seem to match. If the idea is the 10-day lows in price but no 10-day lows in the indicators, then that condition is clearly triggered 2-3 days earlier. What is it missing? Thank you.
Not sure what you mean. I am merely testing the rules that have been recommended in countless articles on divergence.
Some people says that it is worthwile to wait for a white candle to validate a divergence , and take position at the close of the white candle .
Could you further backtest this idea ?
Thanks ,
I could but I’m pretty sure what the results will be like.
Testing this strategies on FANG will give a higher % wins assuming that a lot of people using this divergence strategies on those stocks …
Yes because FANG stocks are only selected in hindsight although we could test them against their buy and hold returns.