
As humans, we have an amazing ability to suspend disbelief. Imagine how many personal mistakes could be avoided if we took a step back and asked, “What is really happening here?”
Right now, there’s a strong case to be made that the stock market is in bubble territory. Everyone knows it, but many choose to bury their heads in the sand.
Whether or not you believe the market is in a bubble or not. You need to consider it as a possibility and be prepared for what comes next. Let’s investigate the current situation.
“There is nothing as disturbing to one’s well-being and judgment as to see a friend get rich.”
Charles P. Kindleberger.
5 Key Charts That Point To A Stock Market Bubble
The first three charts look at relative stock market valuations while the last two look at indicators of investor behavior. We are looking for signs of historically high levels of valuation. We are looking for signs that investors are becoming irrational and overextending themselves.
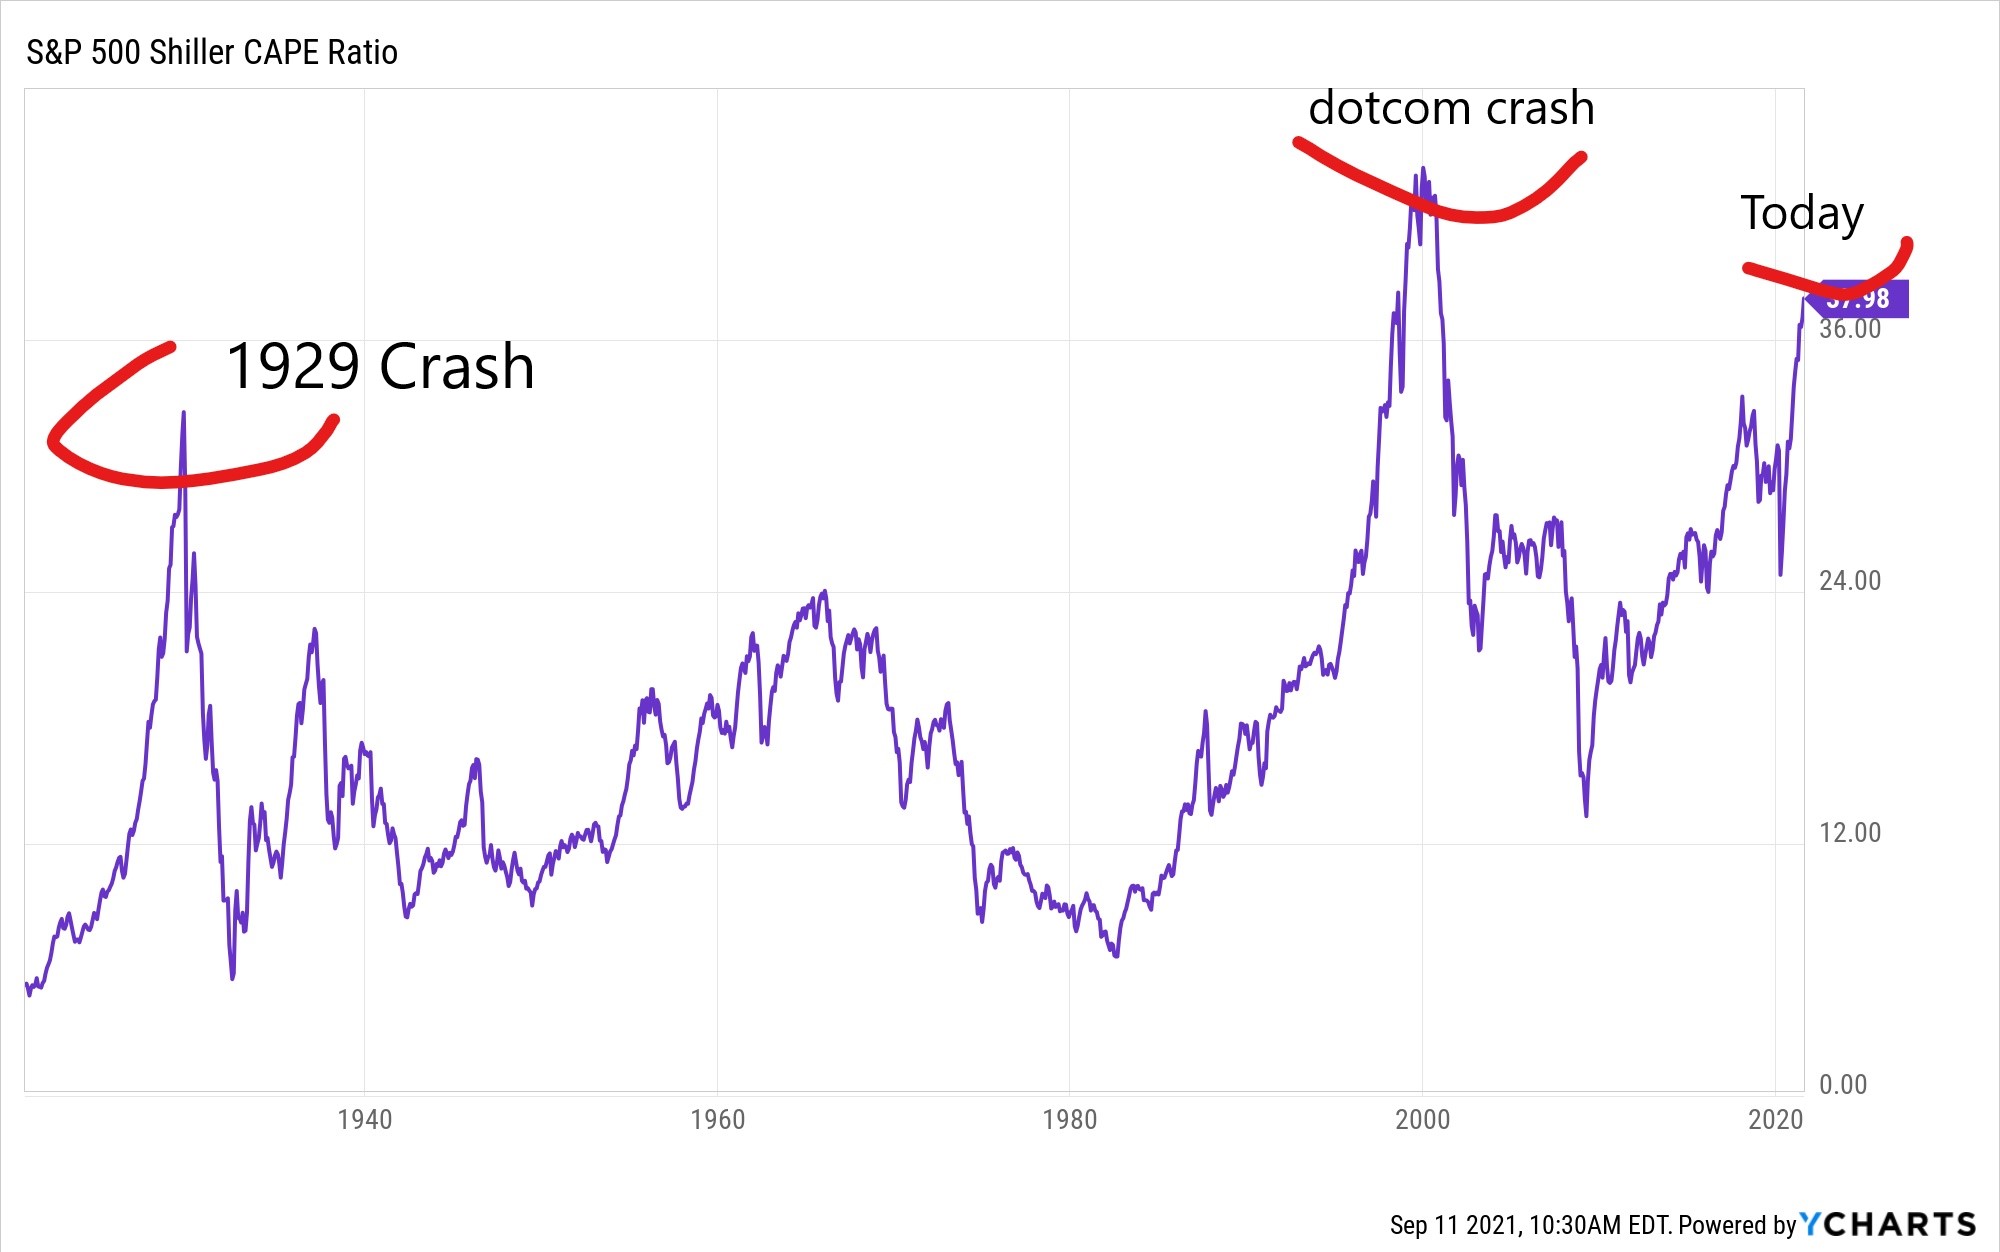
1. CAPE Ratio
The CAPE ratio (also called the Shiller PE ratio) was made famous by Yale economist and Nobel Laureate in economics Robert J. Shiller and Harvard economist John Y. Campbell in their 1998 paper “Valuation Ratios and Long-Run Market Outlook”.
Shiller also predicted the dotcom crash in his seminal 2000 book “Irrational Exuberance”. He also predicted the US subprime collapse in 2007-08. He might be an academic but he’s a smart guy with a good track record.
The CAPE ratio for the S&P 500 clearly shows stock market overvaluation before the 1929 crash and the dotcom crash in 2000 (see chart below).
It also shows that we are at a record high level today: the second-highest level ever! This should get your attention.
CAPE stands for Cyclically Adjusted Price to Earnings Ratio. It’s used to show how a stock price or market index is performing relative to its earning history over the last ten years.
By taking a ten-year perspective it smooths out volatility. It also takes into account how the stock has performed over different economic cycles. It’s much more accurate than a normal PE ratio in showing actual turning points.
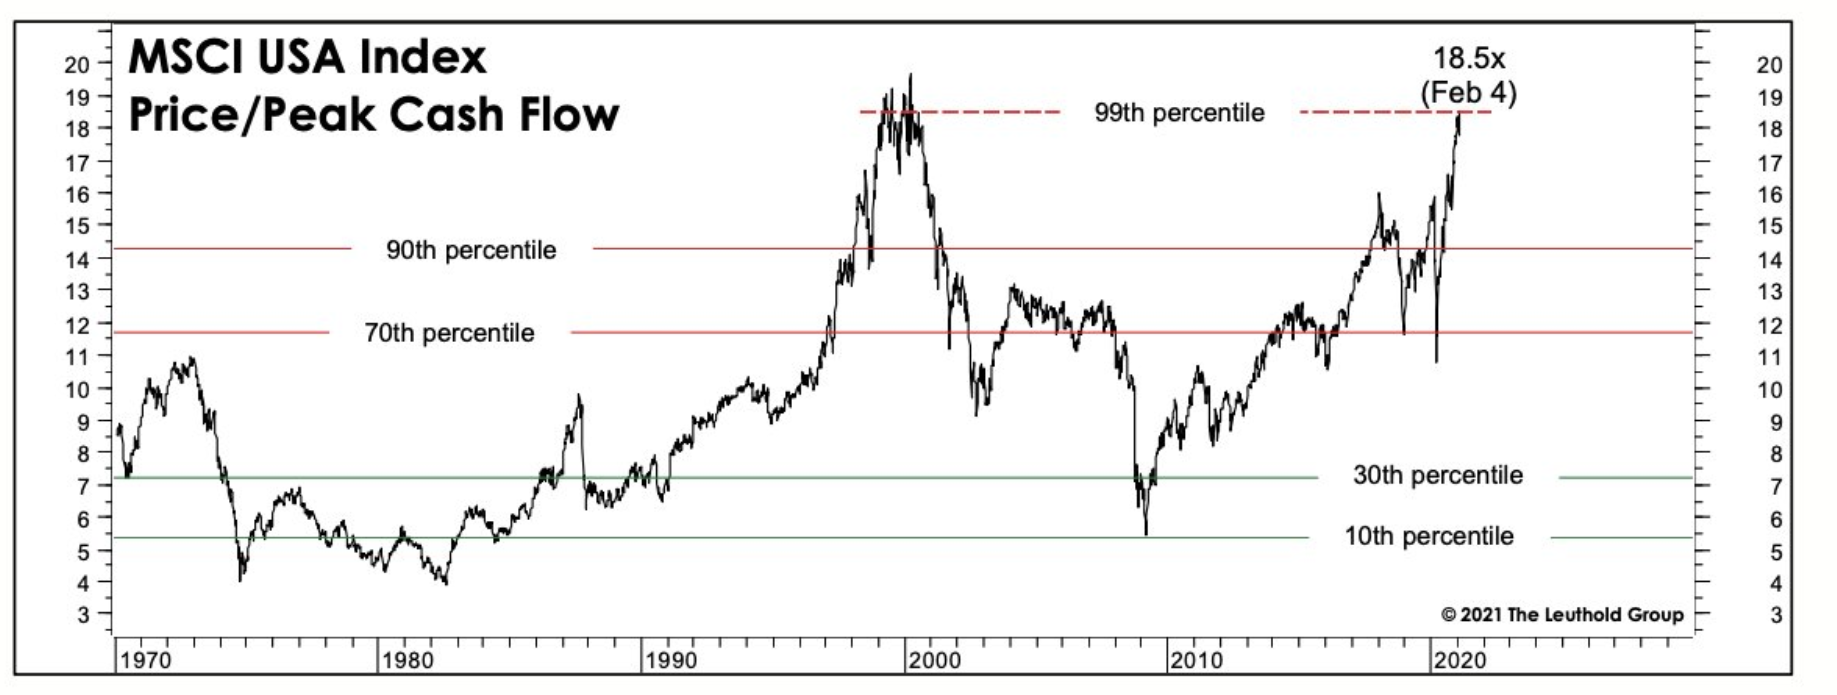
2. Price To Peak Cash Flows
The CAPE ratio presents a strong case but we all know that earnings are only one side of the story. So here is a metric that offers another perspective: price to peak cash flows.
Cash flows are much more difficult to manipulate than earnings. So comparing prices to cash flows will provide a double check on PE ratios like the CAPE ratio.
Once again, two periods stand out: the dotcom crash and today (see chart below).
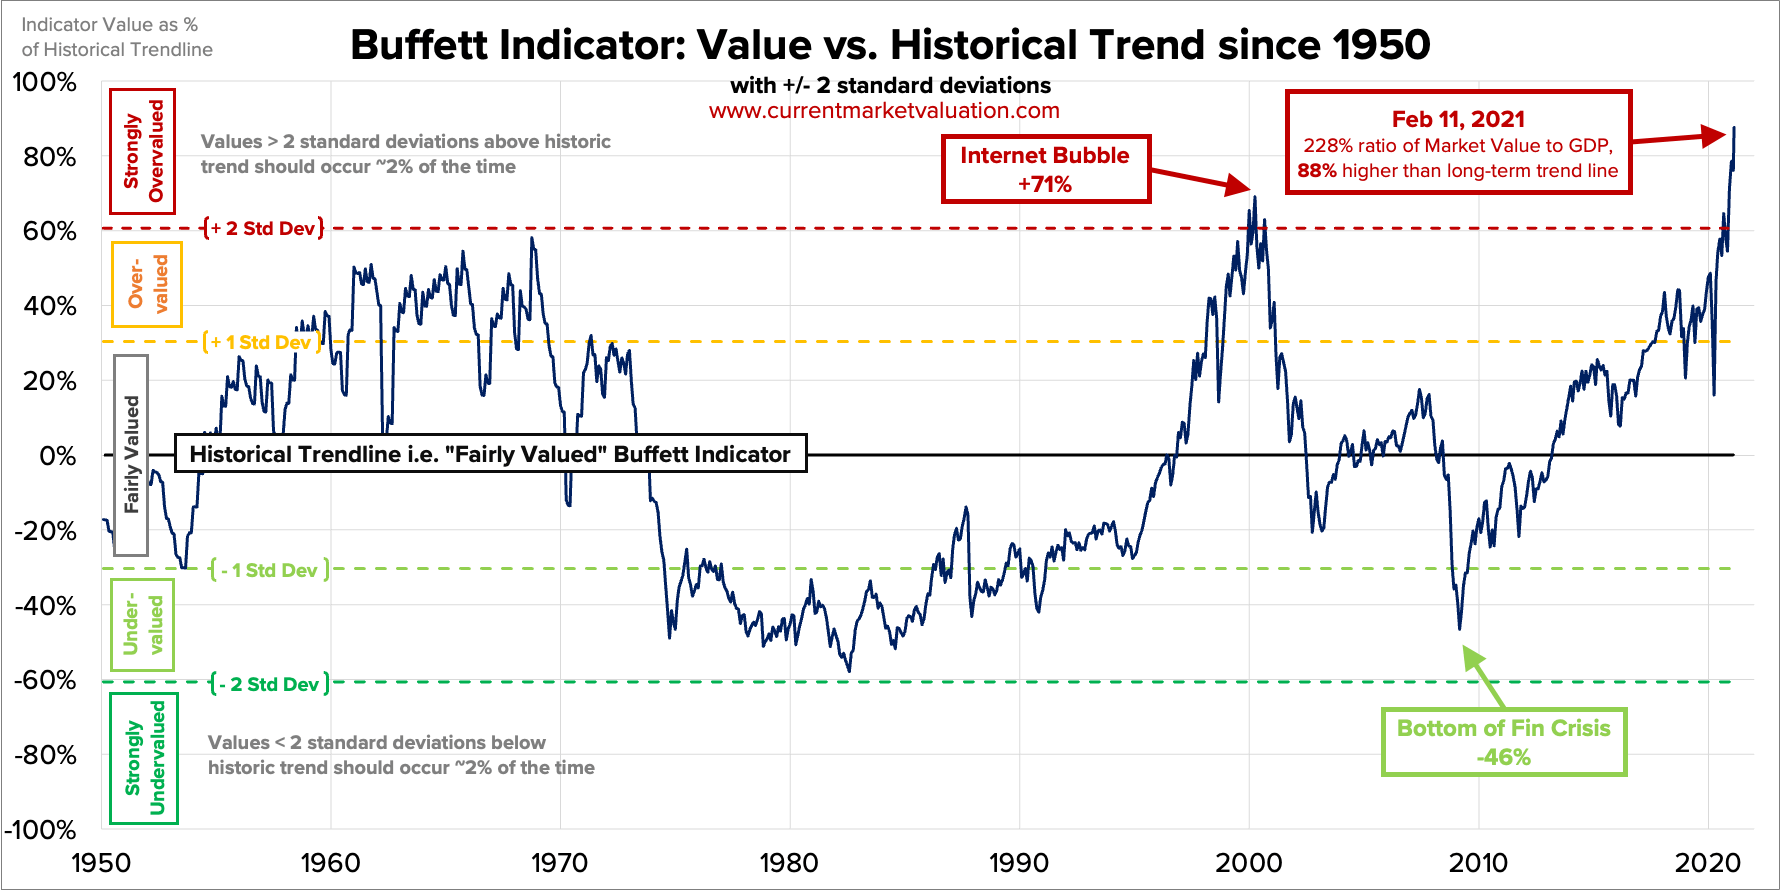
3. The Buffet Indicator
No need to introduce Warren Buffet. The Buffet indicator shows the market capitalisation of an index relative to that country’s GDP. In other words, it shows you how stock market values compare to the real economy.
A high ratio says that the stock market is getting ahead of the real economy while a low ratio says that the market is being pessimistic.
In our case, we are at an all-time high and well above the estimate of fair value (see chart below).
And if we add standard deviations to our analysis then we find we are sitting in the far right tail of a normal distribution – a probability of 1%. The only other time we’ve been at a similar point was before the dotcom bubble.
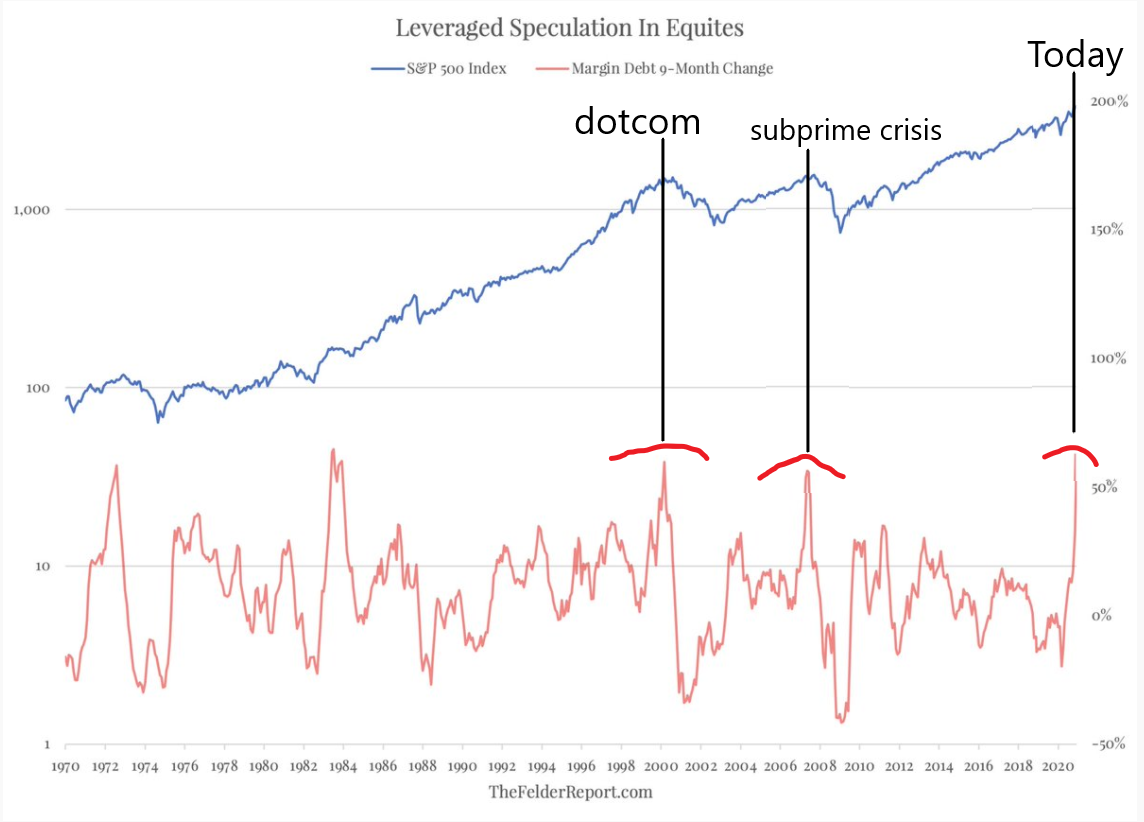
4. Margin Debt
High levels of margin debt are not only a sign that investors are overextending themselves, they also reveal vulnerabilities to downward prices. Any big downturn could thus be accompanied by an extra kick as investors receive margin calls and liquidate positions.
Two of the last three peaks in margin debt preceded the dotcom crash and the subprime financial crisis (see chart below). The third peak is happening right now and has not yet finished growing.
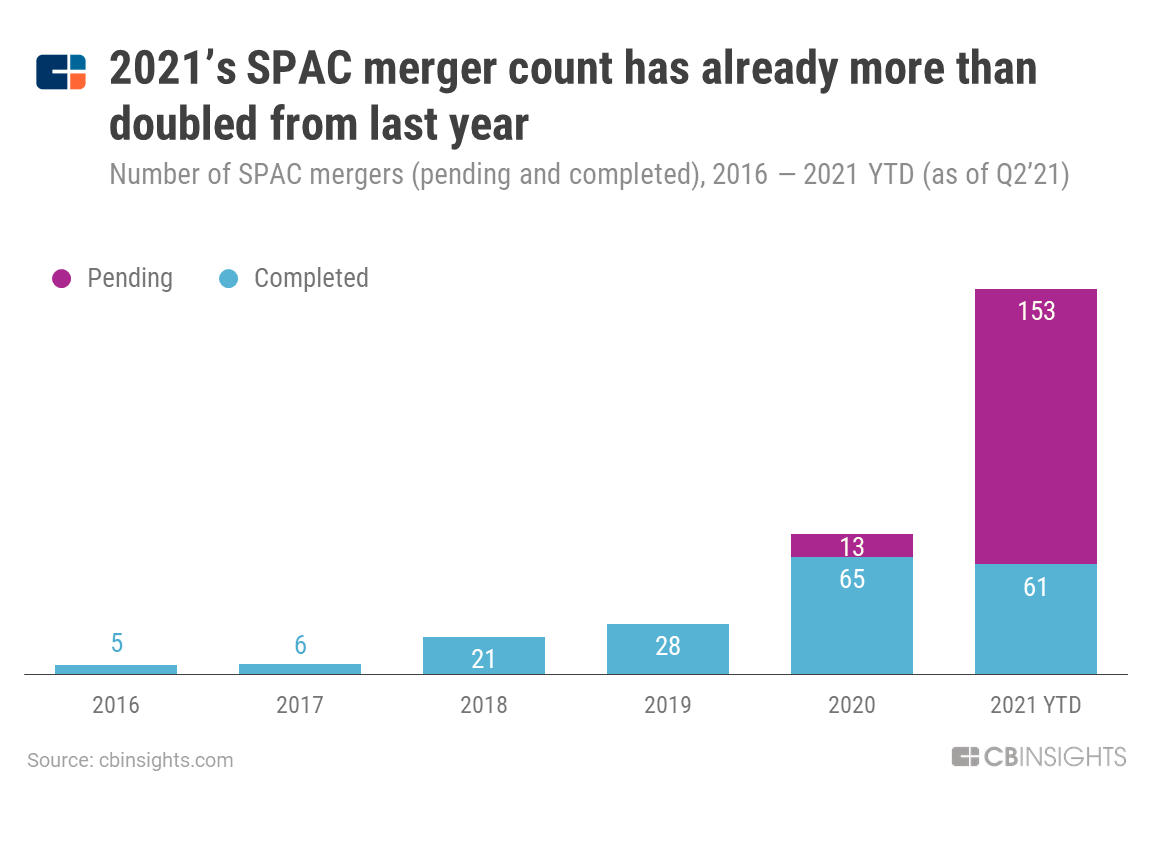
5. SPACs
Another sign of irrational investor exuberance is the recent rise in SPACs. SPAC stands for Special Purpose Acquisition Company. In a nutshell, a SPAC is when you give your money to a listed company that promises to buy another unknown company in the future. Blank cheque investing!
They will also give their investor bank mates better terms along the way. And to make matters worse celebrities have also started to endorse SPACs. Want to buy a SPAC endorsed by Shaquille O’Neal?
SPACs are often a cheaper alternative to IPOs for acquired companies but for investors, SPACs can be a wild ride.
Despite the risks and nebulous reputation, SPACs exploded in 2020 and have already more than doubled in 2021 (see chart below). Investors seem all too happy to speculate.
But Are We In A Bubble?
Relative valuations are at historic and hysteric highs – check. Investors are irrationally exuberant – check. So are we in a bubble? Probably.
One argument against a bubble is that bonds are unattractive at the moment. So all that extra central bank liquidity sloshing around is going straight to equities. This is an argument put forward by Shiller in 2020 when he came up with a new version of CAPE called the Excess Cape Yield.
There is also the argument that equities are high at the moment because interest rates are low. This can be particularly seen with tech stocks.
The problem with both these arguments is that interest rates are going to rise as tapering begins. Inflation will also have an impact.
For a look at what Michael Burry of Scion Asset Management is thinking about the bubble, check out my article from June.
Don’t Panic! What To Do Next
But for long-term investors there is nothing to gain by panicking. A better approach is to consider your position carefully and plan for different scenarios.
By buttoning down the hatches now, you may lose some forward-looking opportunities but you will be in a much better position if a storm does hit. Take minor losses on the upside to avoid a massive downside.
If you have systematic trading strategies that are backed by experience and data, stick to your guns. Plenty of systems will generate alpha even if the bubble pops.
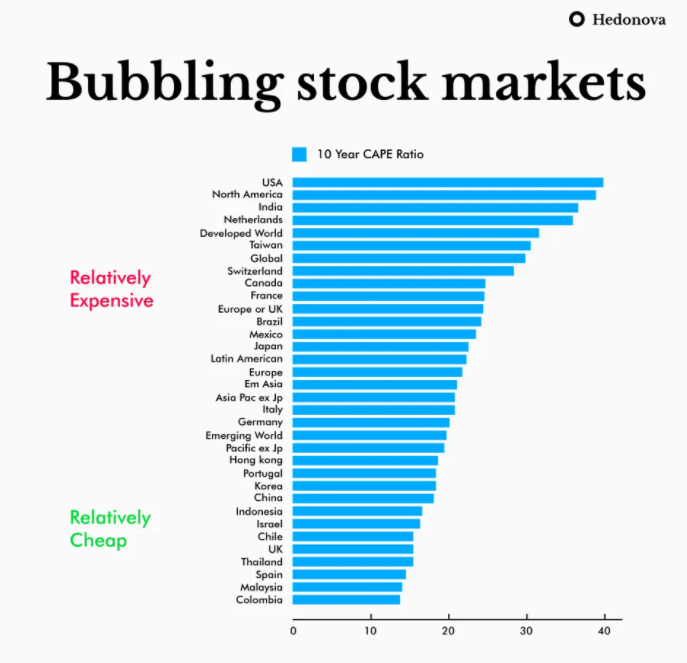
It’s also important to remember that there’s always an opportunity somewhere. The S&P 500 may look extended but emerging markets and Europe offer better value. China and the UK look particularly attractive based on their 10 year CAPE ratios.
There may also be some value to be found in small caps. As the chart below shows, small cap companies are trading at 20-year low valuations compared to their large cap counterparts. The market as a whole may be expensive but some small caps offer opportunity.

And so that is exactly what I am doing. For my short-term account, I am trading two strategies that are relatively uncorrelated to the market. For my longer-term account, I am keeping some cash aside and investigating opportunities in smaller caps and foreign companies.
Final Thoughts
If you have skin in the game then you need to keep an open mind and pay attention to the state of the market. Nobody knows the future but there is always a crack before the dam bursts.
The charts above suggest that we could be in a bubble and that it could pop at any time. All it needs is a trigger. A slowing economy and the delta variant reaping havoc in the northern hemisphere could be that trigger. Inflation or a taper tantrum could also be a trigger. In any case, better to prepare now than to be surprised later.
The best investing opportunities are to be found at market bottoms, not market tops.
Thank you for this article. I’ve been thinking along the same lines and it appears I’ll have to start on Plan B sooner rather than later.
For further in-depth analysis, please read the following article, written by a highly respected business journalist here in Australia – it is free.
https://www.theage.com.au/business/banking-and-finance/the-us-is-just-weeks-away-from-defaulting-on-its-debt-and-unleashing-financial-chaos-20210909-p58q6i.html
The debt ceiling debates are mostly ceremonial and always get resolved. However, it does seem like a high stakes game to play.