When you’re new to investing it can be difficult to separate out the noise from the truth. There is a whole industry out there dedicated to keeping you updated with market events, telling you which stocks to buy, which stocks to dump, and when to do so.

But if you are a long-term buy-and-hold investor in the stock market, there is only really one detail you need to know. That is, If you want to succeed you should put your money to work as soon as possible.
This makes sense for two reasons.
Firstly, because attempting to time the market is a fool’s game for buy-and-hold investors.
And secondly, because the longer your money is in the market, the more you can compound your wealth and the better off you will eventually be.
To show this, we can fire up the Amibroker trading simulator and test some examples.
Should you wait for the next market crash?
A student of my value investing course made an interesting comment recently and asked the question: if you are a long-term investor, should you wait for a market correction?
The reasoning behind this line of questioning is clear.
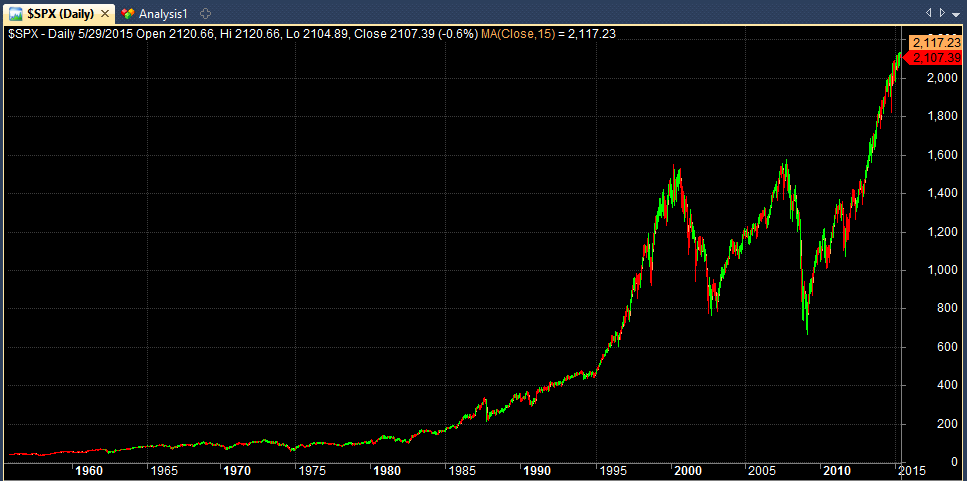
If you were unlucky enough to have invested on the 1 January 2007, your total return 8 years later would have been around 45% in profit (before reinvested dividends). Yet if you’d invested two years later on the 1 January 2009, you’d be sitting on a 127% return. That’s a compounded annual return of 14.64%.
In other words, by waiting for a market correction, you would have made almost three times more profit.
This all sounds good in theory, but nobody could have predicted the severity of the financial crisis in 2008 and as a result, many investors have been sitting on fairly low returns.
Not only that, but some investors are now afraid to enter the market because they would rather wait for another downturn.
Smoothing market returns over time
The good news for long-term investors is that market returns smooth out over time. The longer you stay in the market, the less market timing becomes an issue. Again, we can use the data to back this up.
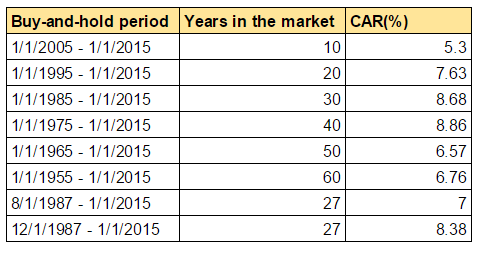
Following shows some examples of the type of nominal returns (before dividends) to expect from buy-and-hold on the S&P 500 Index over different time horizons. In each example the strategy is to invest $10,000 into the index at the start date and keep it invested until 1/1/2015. The following table summarises these results:
2005 – 2015
So, investing $10,000 in the S&P 500 on the 1 January 2015 would have returned 5.30% annually by 1 January 2015 resulting in a net profit of $6,755.84.
1995 – 2015
Investing $10,000 in the S&P 500 on the 1 January 2015 would have returned 7.63% annually by 1 January 2015.
1985 – 2015
Investing $10,000 in the S&P 500 on the 1 January 2015 would have returned 8.68% annually by 1 January 2015.
1975 – 2015
Investing $10,000 in the S&P 500 on the 1 January 2015 would have returned 8.86% annually by 1 January 2015, resulting in a net profit of $288,566.25.
1965 – 2015
Investing $10,000 in the S&P 500 on the 1 January 2015 would have returned 6.57% annually by 1 January 2015.
1955 – 2015
Investing $10,000 in the S&P 500 on the 1 January 2015 would have returned 6.76% annually by 1 January 2015, resulting in a total net profit of $471,787.18.
Before and after a market crash
We can also test what returns we would have made if we had the skill to perfectly time the market.
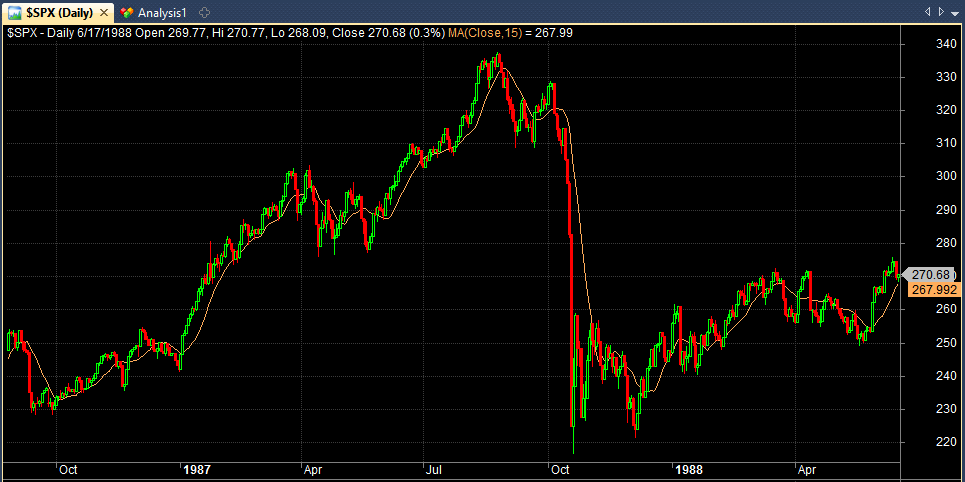
For example, by investing $10,000 in the S&P 500 on the 1 August 1987 (right before the 1987 crash) you’d have returned 7% annually up to 1/1/2015. Investing on 1 December 1987 (right near the low) and you’d have returned 8.38% annually.
So even if you were able to pick the high and low in the market with great skill you would not have seen a massive amount of difference over the very long term.
A word about inflation and dividends
As already mentioned above these are nominal returns. They do not include reinvested dividends and they are not adjusted for inflation, but they are still useful benchmarks.
By reinvesting dividends you could expect to increase these returns by a few percent. On the flipside, inflation will naturally erode your real value by 1% – 3%. This explains why returns from 1975 are better than from 1965, because the 70’s was a time of very strong inflation.
Conclusion
I don’t want to say that market timing is futile. There are certain indicators, such as CAPE or the market cap to GDP ratio, that I believe to be useful. The problem is that these indicators can stay expensive for very long periods and waiting for them to come down to the appropriate levels can be problematic.
Over long-term horizons (20 – 40 years or more) annual returns smooth out. So there is not a lot to be gained by worrying about market-timing. As a buy-and-hold investor, it’s generally better to get your money into the market as soon as you can and leave it there.
If you don’t have 20 – 40 years, then that’s when you introduce bonds into the mix, to guarantee a smoother ride. And of course, there are plenty of other ways to construct a diverse portfolio. You don’t need to sink all your money into the S&P 500.
Markets will always rise and fall but worrying about the next market correction can be counterproductive.
Tests made with Amibroker using Norgate Premium Data. Get a free trial here.
This article also appears in my value investing course.


