
I’ve always wondered whether you can improve a trading strategy by including fundamentals.
For example, should you trade mean reversion stocks with a low PE or a high PE?
Most mean reversion strategies use technical indicators and the RSI(2) and RSI(3) indicators are particularly popular among traders.
However, there isn’t much research on combining those indicators with fundamental analysis.
In this article, I will start with a simple RSI(2) trading strategy and then we will see if it can be improved with the inclusion of price-to-earnings rules.
Setting Up The Backtest
Before we go any further I’m going to explain the backtest setup because there are some potential issues that we need to be aware of.
To run this test I will be using Norgate data for end of day prices and Intrinio for fundamentals. This process involves pulling in historical fundamental data from Intrinio into Amibroker using their API.
Although Intrinio includes pricing data for delisted stocks, I have not yet been able to match up price-to-earnings data for some of the stocks in the Norgate database.
To get around this I am going to test our strategies without delisted stocks. We will then compare them to results that includes delisted stocks.
Although our analysis won’t be perfect, we will hopefully be able to produce something meaningful and see if there is any effect from introducing the price-to-earnings data.
Strategy Rules
We are going to run a simple RSI system on a database of S&P 100 stocks. This system is adapted from one I wrote about previously.
The rules are as follows:
Buy Rules
- 2-Day Cumulative RSI(2) < 10
- Average Turnover > $250,000
Sell Rules
- Sell = RSI(2) > 65
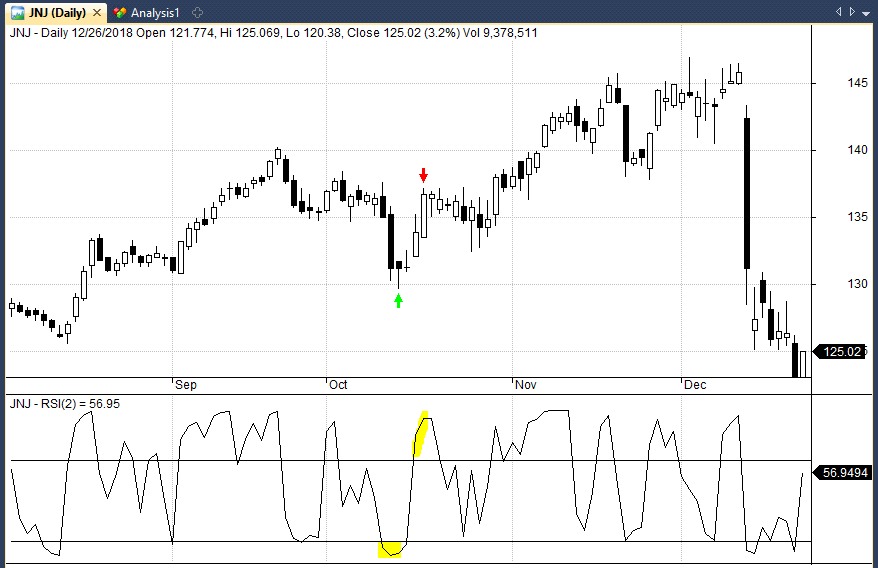
Very simple rules. Next is an example of the trade setup in Johnson and Johnson.
We go long when the 2-day cumulative RSI(2) is less than 10 and we exit when RSI(2) crosses over 65:
Now we know the rules of this setup we can backtest it on historical data.
For this we will use a fixed position size of $1000 and we are going to test every set up in the S&P 100 between 1/2007 – 7/2019.
We will run five tests as follows:
- Test 1 – On S&P 100 including delisted stocks
- Test 2 – On S&P 100 without delisted stocks
- Test 3 – On S&P 100 without delisted stocks and P/E < 15
- Test 4 – On S&P 100 without delisted stocks and P/E => 15
- Test 5 – On S&P 100 without delisted stocks and Negative P/E
Backtest Results
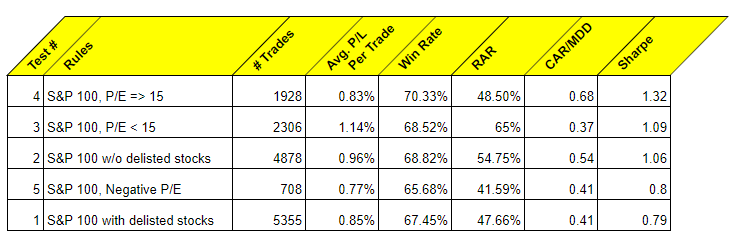
As you can see from the table above, we got some mixed results from this analysis.
The best profit per trade came from test three (buying low RSI stocks with a P/E less than 15).
However, the best win rate and Sharpe ratio came from test four (buying low RSI stocks with a P/E over 15).
There was clearly a negative impact from including delisted stocks in the database because this produced the worst Sharpe ratio.
However, the performance was not as bad as you might expect.
There was also a clear negative impact from including stocks with negative P/E values.
Test Four Produced The Best Sharpe
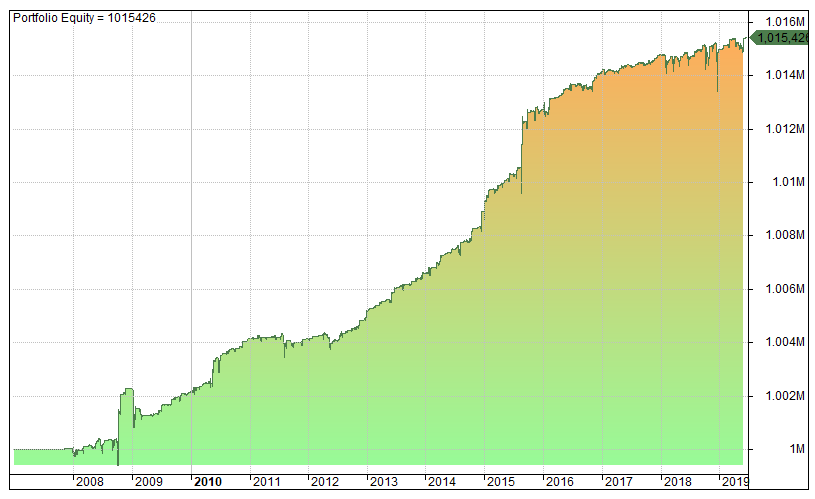
It has to be said that a Sharpe ratio of 1.32 for test four is quite high and it will be good to test this again on other markets and incorporate delisted securities.
The following graphic shows the equity curve from test four. Remember this is without any real position sizing or portfolio rules:
Conclusions
In this article we looked at a classic RSI(2) trading strategy and observed the impact of using historical price-to-earnings data pulled from Intrinio.
Although we were not able to include delisted stocks there is some evidence that including price-to-earnings data is useful for mean reversion trading.
The best win rate, CAR/MDD and Sharpe ratio came when trading stocks with a P/E of 15 or higher. Meanwhile, the best profit per trade and RAR came from trading stocks with a P/E under 15.
The conclusion seems to be that it’s best to avoid stocks with negative P/E ratios. This makes sense because stocks with negative P/E ratios are losing money (they have negative yearly earnings).
So it seems that you can improve your mean reversion trading by ignoring stocks that have negative earnings. These stocks are more likely to fall further while stocks with positive P/E ratios are more likely to bounce back.
Next steps for this strategy would be to do some more stress testing, find a way to incorporate delisted tickers and then turn this into a full portfolio system with real life constraints such as portfolio size and commissions.
Charts and analysis produced with Amibroker with historical data from Norgate and fundamental data from Intrinio.
I retesting Analysis – Thank you!
It would be interesting to perform this analysis on a trend following system to see what the impact of PE is on a longer term trading system.
Absolutely. I ran a couple of tests and it was looking like low PE is better for trend following but I’ll definitely look at it more in depth.
Excellent post, I have often wanted to test different fundamental measures as well, but could never find accurate historical fundamental data–thanks for the info re: Intrinio.
Data from intrinio looks pretty good to my eyes, Thanks