
The last few months we have seen a surge in traders looking at forums such as Wall Street Bets trying to identify meme stocks and the next GameStop. This type of trading could be classed as sentiment analysis trading. Investors attempt to make money in stocks by assessing what other investors are talking about.
Sentiment trading is not new. In the past, investors have looked at investment surveys, newspaper articles or magazine covers. However, the rise of the internet and social media has taken sentiment trading strategies to a new level. Not only do social websites allow investors to tap into the feelings of millions of traders, the data is now being collated and sold to traders looking for an edge.
Testing Sentiment Analysis Stock Data From InfoTrie
I have been interested in sentiment trading for some time so I decided to download some historical sentiment data from a company called InfoTrie.
This data package is called FinSentS Web News Sentiment and includes daily sentiment indicators for 49,000+ global stocks since 2013 across various publicly available internet sources. According to the website:
InfoTrie is a News Analytics, Financial Engineering and Big Data company. They are headquartered in Singapore with offices in India and Europe. The FinSentS News Sentiment (NS1) data feed offers daily media sentiment indicators for 49,000+ global equities, calculated by applying sophisticated real-time machine-learning algorithms to the content of thousands of news websites and media sources from around the world. Historical data goes back to 2013.
One thing to say right off the bat. The sentiment data from InfoTrie is not cheap. It costs $40/month to gain access to 1-years worh of sentiment data but to download the full history is a pricey $1,150 per year. Maybe the data has some strong edges that make the cost worth it? Let’s run some analysis to find out.
Sentiment Analysis Indicators
The data from InfoTrie consists of five metrics:
- Sentiment Score: a numeric measure of the bullishness / bearishness of news coverage of the stock. This ranges from -5 (extreme negative sentiment) to +5 (extreme positive sentiment.
- Sentiment High / Low: highest and lowest intraday sentiment scores. This is polled at 5-minute intervals.
- News Volume: the absolute number of news articles covering the stock.
- News Buzz: a numeric measure of the change in coverage volume for the stock. Change is measured by standard deviation and is normalised on a scale of 1-10 (1 means low level of news buzz and 10 means a high level).
In other words, InfoTrie searches through millions of online data points and scores stocks based on sentiment and news flow. The following table shows the typical output for the stock symbol TWTR:
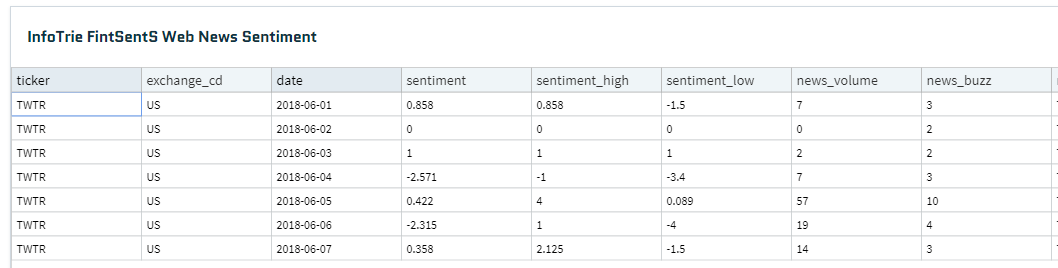
If we look at the chart below, you can see how Sentiment data is reported over the course of the year for GameStop.
The top window shows the price chart, below that is the sentiment score (black), below that is the news volume score (blue) and below that is the news buzz score (green):
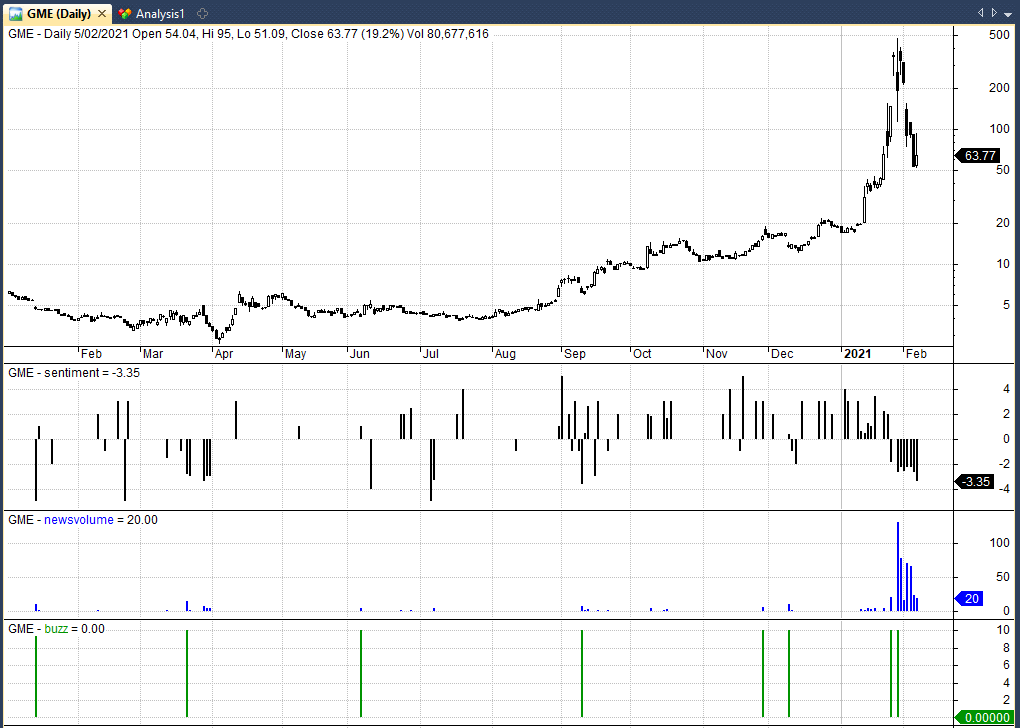
Based on this data, I make the following observations:
- Sentiment data for GameStop appears to fluctuate from positive to negative over the course of the year. It is generally positive from October 2021 and turns negative towards the end of January. Because the sentiment score is quite choppy it might make sense to overlay a moving average on the data.
- Apart from a few spikes, news volume is generally low over the year and does not pick up until the 26th January, when the rise in GameStop is in full swing. News volume might therefore be a lagging indicator and more useful as a sell indicator.
- News buzz hits the highest score of 10 on eight separate occassions. News buzz represents the rate of change of news flow so it makes sense that it would be a 10 at the same time as news volume spikes higher. However, there was no change in news buzz between December 12th and January 26th. This would have been an ideal time to enter GME.
- Overall, the data looks quite noisy at first glance. I’m not too sure how this data would have accurately signalled a good time to get in the trade.
Test One – Logic Test
Considering the indicators available, a logical trading strategy might be to buy a stock that has a high sentiment score, a high news volume and a high news buzz. Such a stock can be said to be experiencing significant positive sentiment and abnormal news coverage.
To test this, I downloaded sentiment data for 4,512 US stocks between January 2020 to January 2021 and tested a simple strategy that buys stocks with a positive sentiment score (over 1), a high news volume (over 10) and a high news buzz (over 5).
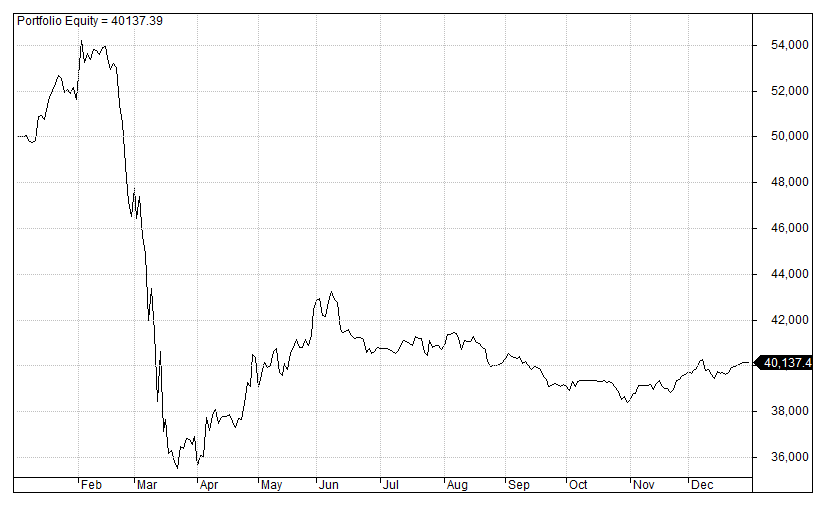
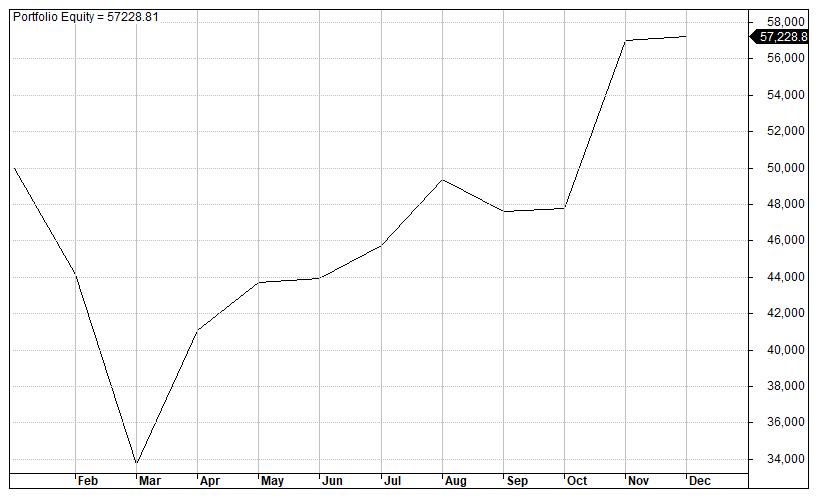
Using a holding period of 10-days and a starting capital of $50,000 this strategy produced a loss of -19.73% a maximum drawdown of -34.53% and a win rate of 50.43% over 154 individual trades.
Even considering the impact of the coronavirus crash in March, this is a particularly bad result from our first sentiment strategy. The equity curve is shown below:
After this, I tested several other variations but I was unable to make any significant improvements on the performance shown above.
Test Two – Replicate BUZZ ETF
An alternative strategy is to consider a ranking type strategy that is always invested in the market. This is similar to the methodology behind the recently released BUZZ ETF from Dave Portnoy.
Using the data from InfoTrie we can attempt to replicate the BUZZ ETF by ranking stocks by Sentiment. The BUZZ ETF has some things that I don’t like. It only invests in stocks over a $5 billion market cap and has a portfolio of 75 positions. Too many.
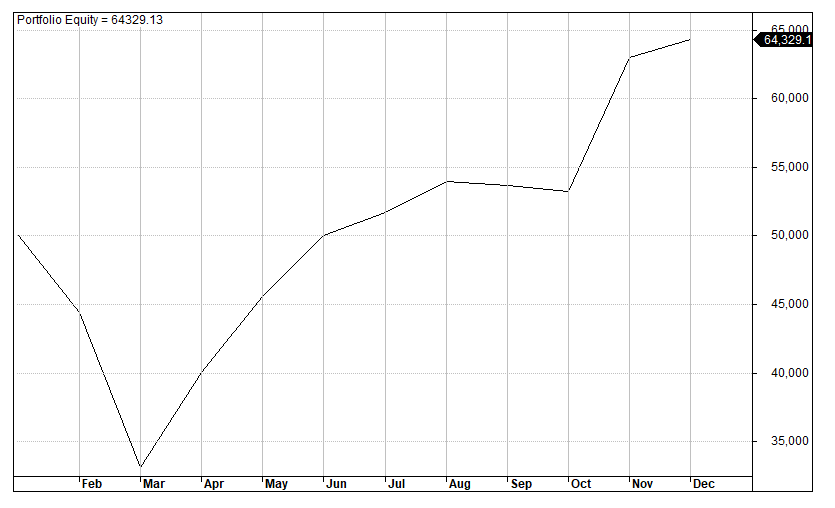
This test will buy the top 25 stocks from our universe with the highest sentiment scores according to InfoTrie from the previous month. We won’t discriminate based on market cap and we will equal weight each position (4% position size). We will rebalance each month so that the portfolio is constantly holding the top 25 highest sentiment tickers.
Using a starting capital of $50,000 this portfolio produced a much better return of 31.59% in 2020, a maximum drawdown of -33.82% and a win rate of 58.40%.
Test Three – Reverse Logic
For our final test, I reversed the logic of the BUZZ ETF so that we will buy the 25 lowest sentiment stocks each month.
Using the same portfolio settings as previously, this test produced a return of 15.85% in 2020 with a maximum drawdown of -32.61% and a win rate of 49.23%.
Note that when I combined the low sentiment score with a high amount of news volume, performance greatly improved to +31.62% with a maximum drawdown of -22.57% and a win rate of 54.23%.
Conclusions For Sentiment Analysis Stock Trading
In this article I downloaded historical sentiment data from InfoTrie for 4,512 US stocks and tested various trading strategies based on sentiment. We found that buying the highest sentiment stocks did produce a positive return in 2020 which almost doubled the S&P 500 return of 16%.
However, it should be noted that 2020 was a stand out year for sentiment stocks so more data is needed to make firm conclusions.
I was also unable to find any individual trading strategies (other than ranking style) that beat buy and hold. After several hours working with the data I did not find a particularly strong correlation between sentiment and price return.
I found that sometimes high sentiment produced good entry points and at other times, very low sentiment produced good entry points. Reviewing the chart of Tesla below (which is a classic sentiment stock) you can see that the sentiment data is very noisy. It fluctuates from positive to negative throughout the year:
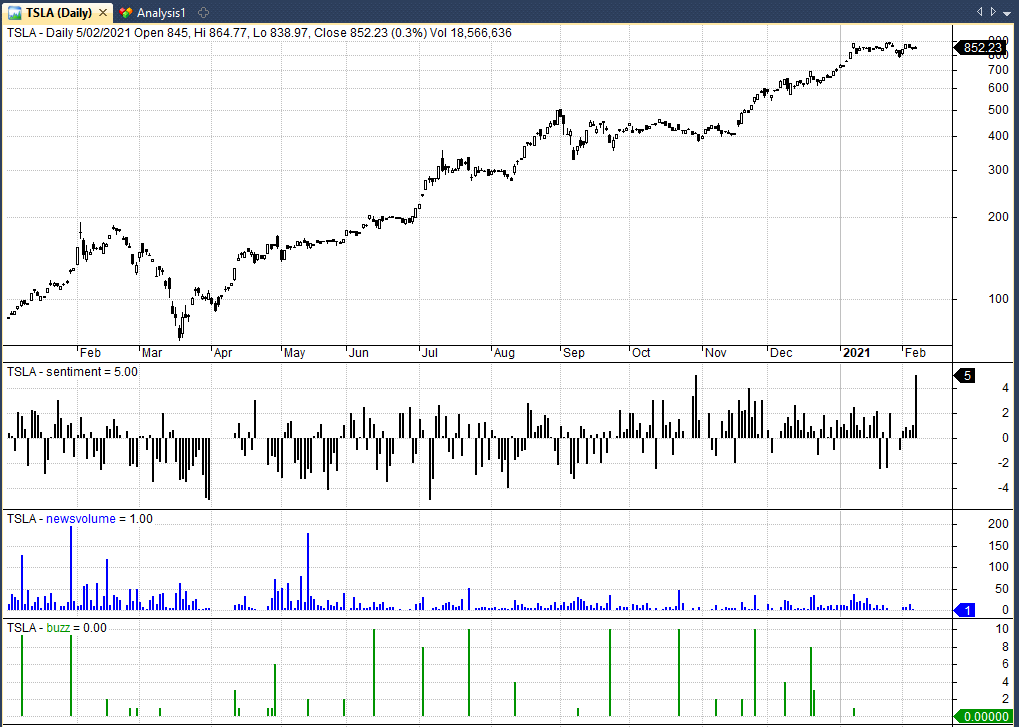
I expected Tesla to show much stronger trends in Sentiment than shown here and I found a similar story in other high sentiment stocks.
Despite the positive results from the ranking strategy, I’m not convinced that the sentiment data provides enough of an excess return to make it worth subscribing.
If you want to start your own ETF tracking sentiment, then this is one way you might go about it. But for $1,150 per year, the cost of this historical data, I was expecting more.
Notes: Data in this article from InfoTrie. Simulations produced in Amibroker.
One idea might be to test a change in sent. score from >= +1 to <= -1, and vice versa.
Thanks, I will try it.
I wonder if by itself Sentiment has meaning. I use it as one of many things I track on a dual screen of Daily and Hourly charts. Buy itself It is not much and is not a long term play. But of course what is these days other than a 4 to 20 day run up or down. The evidence is thin. But so is so much of what passes for reality. Time decay is an issue I all too well understand at age 72! God Bless and take good care and be well!
eb
Hi Joe, thanks for a good article! I was looking for a reference to Sentiment trading and this will be perfect. Looking at the Gamestop data, I don’t think it would do badly if you just set a buy threshold at +2 and a shorting threshold at -2. Tesla, on the other hand would not trade well using this kind of sentiment.
For my algorithmic work I use a slightly different kind of sentiment. I find multiple algorithms (usually around 50) which give good backtest results, then I compare how many are currently bullish to how many are bearish and that gives me a sentiment reading. The simulations look good, so I’m paper trading it right now and we’ll see how it goes 🙂
Regards,
Andrew
Sounds interesting, thanks.