
If you are reading this blog you most likely already know about momentum investing strategies. In a nutshell, momentum traders buys past winners, often of the past 12 months, in the hope that these stocks continue to go up.
There are several explanations to why momentum investing works. One is that investors buy past winners because these are the ones talked about in the news. This acts to drive prices even higher. Another is that past performance attracts new capital which again drives up prices.
Keep in mind that stock prices generally represent investors’ expectations for the future. If a company is trading at 220 times its annual earnings (P/E ratio), like Tesla (TSLA), investors believe that the business will be able to grow, thus justifying it being worth so much today. On the other hand, if a company has a low P/E ratio, such as Ford (F), market participants might have major doubts about its ability to grow income in the future.
Company results, company news such as new products, and the state of the economy are some of the main sources of new information that indicate how future cash flows might increase or decrease. We learn about new things at one moment in time, such as when Elon Musk presents a brand new battery technology. The market should react immediately to the news. In reality, the market often underreacts (especially in tech, as we will see in a moment).
Below is an illustration from a paper by AQR Capital Management.
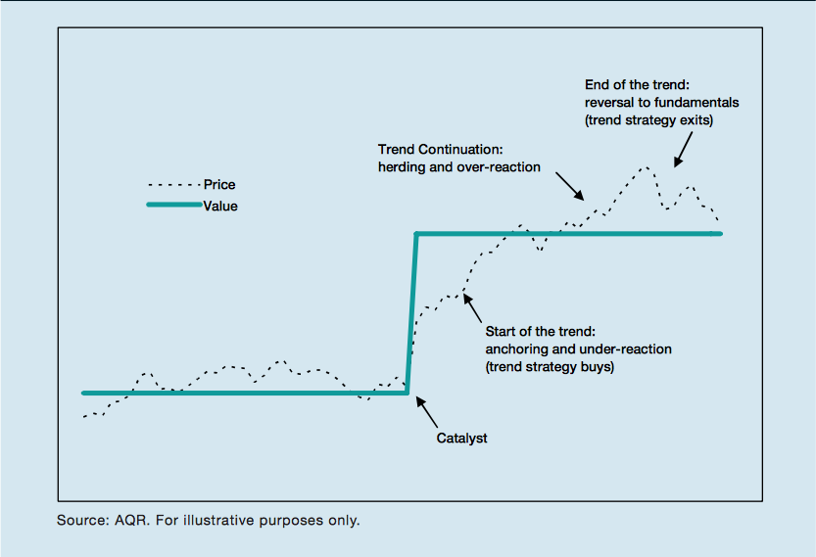
A catalyst event (such as the presentation of a new battery technology) immediately justifies a higher fundamental value of the stock. However the price adjustment is not immediate. Instead, after an initial price increase, the trend continues until the new value is reached.
In a typical momentum strategy, one invests in the best performing stocks of the past 12 months. So without knowing the exact fundamental reason (the “catalyst”), one expects the winners to continue to trend up.
The Issue With Momentum
A momentum investing strategy that just identifies past winning stocks and buys them delivered exceptional returns in the past. We see this by looking at the momentum portfolios from Fama/French’s data. The darker line in the chart below shows the performance of a strategy that invested in the top 10% best performing stocks of the past 12 months (excluding the very last month) and rebalanced monthly.
The light-blue line is the performance of a strategy that invested in the bottom 10% (worst) performing stocks. The difference is remarkable:
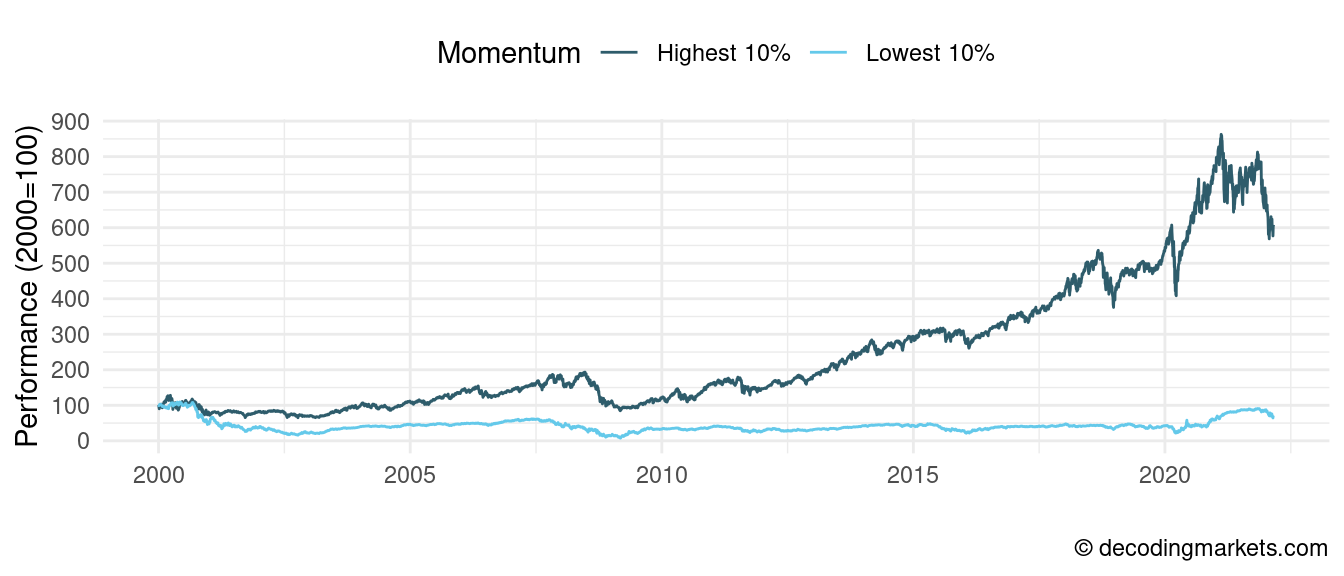
However, we also see that the high-momentum portfolio went through some massive drawdowns, losing over -50% in 2002 and 2009, and -35% by the time of writing in late March 2022. Even worse, momentum does an exceptionally poor job at recovering after bear markets.
To understand why this is the case, we have to think what a momentum strategy invests in and when.
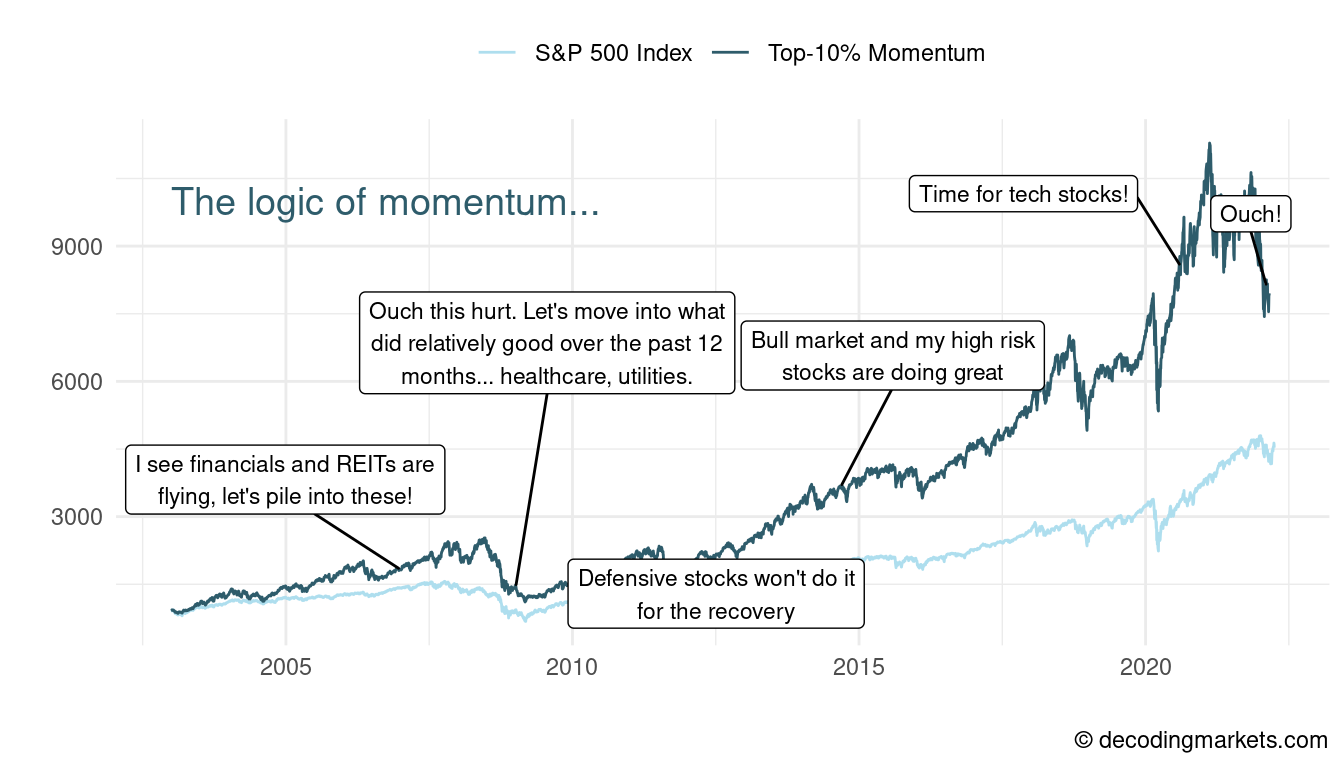
In a bull market, momentum goes into high risk stocks (“high beta”). These will do great for as long as the bull market continues, but will drop even more once the market corrects. Then, after a market crash, momentum will switch to low-risk defensive stocks. Why? Because these are the relative winners during a bear market. The problem is that eventually the market will recover, and momentum will not be able to capitalize on that by still holding on to the low-risk positions.
Below is an illustration of momentum’s “reasoning”:
Fundamentals To Improve Momentum
If momentum works because stock prices initially move too little to new information, one can assume that this is stronger in some stocks. Also, because an unconditional momentum strategy has a bias towards volatile stocks during and after bull markets (and towards defensive stocks during and after bear markets), there may be a way to limit exposure to either high or low-risk stocks.
Using data from Sharadar (available on Nasdaq Data Link) we can compare momentum by industry sectors, daily enterprise value (EV) over EBITDA, price-to-book value, price/earnings, price/sales, and risk. We exclude small-caps as well as non-US and ADRs stocks.
We sort the universe of stocks by their performance over the past 12 month but exclude the very last month. We then allocate them to five equal-size groups (“quantiles”), from the lowest to the highest.
Which Sector Is Best For Momentum Investing?
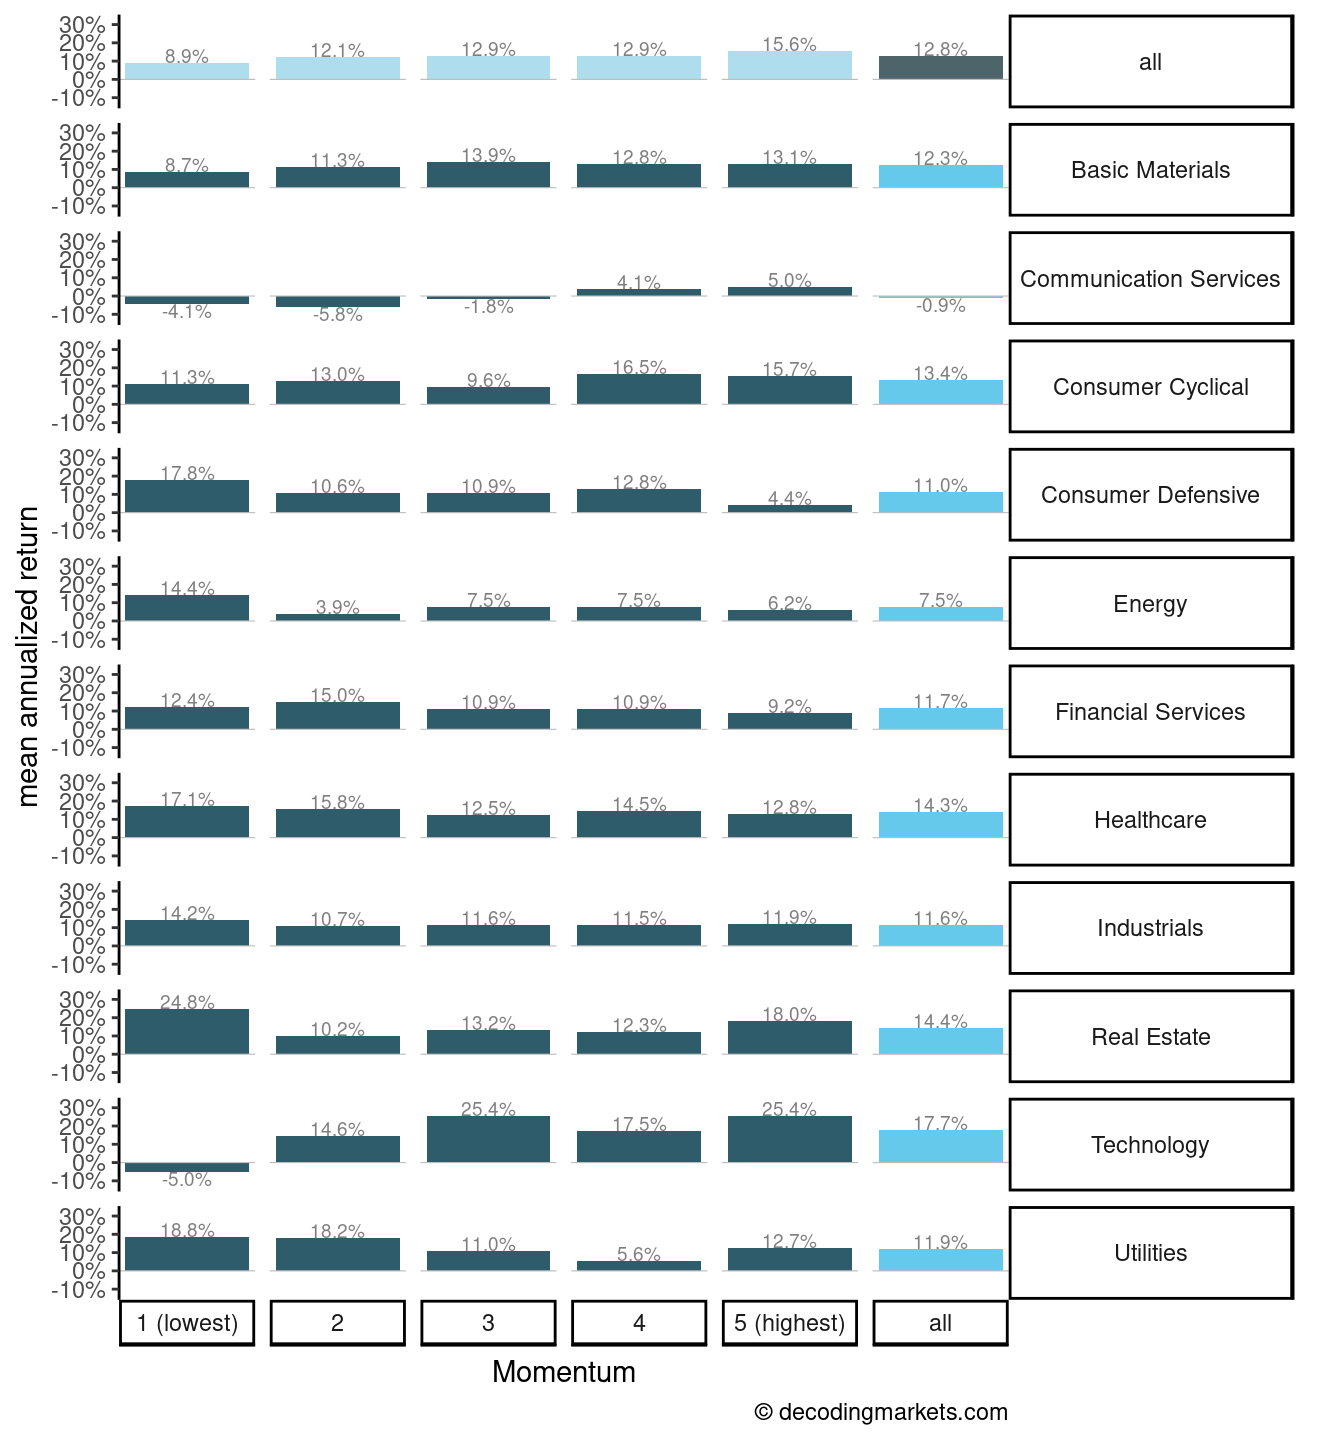
In the plot that follows, we show the return of each momentum portfolio by sector. The left column shows the returns of the lowest momentum stocks, basically past losers. The second to right column are the returns of the highest momentum stocks.
If momentum investing works as we expect, then the return of the high momentum portfolios should greatly exceed the return of the low momentum portfolios. This is the case overall (see the first row “all”). Past losers had an annualized return of 8.9% while past winners returned 15.6%.
Technology stocks also show a very clear momentum effect with the lowest momentum portfolio even having negative returns (-5%). This makes sense if we think of technology as a sector with a lot of catalyst events. When a new product or technology is revealed, the general public often remains skeptical (see this ad, no endorsement!). Only with time, people start to understand and the price goes up.
The momentum effect is strong also in basic materials and consumer cyclical.
On the other hand, typical defensive sectors seem unsuitable for a momentum strategy. In consumer defensive, healthcare, energy and utilities, past losers outperform past winners, basically showing a mean-reversal pattern.
Best P/E, P/B, and P/S for Momentum Investing
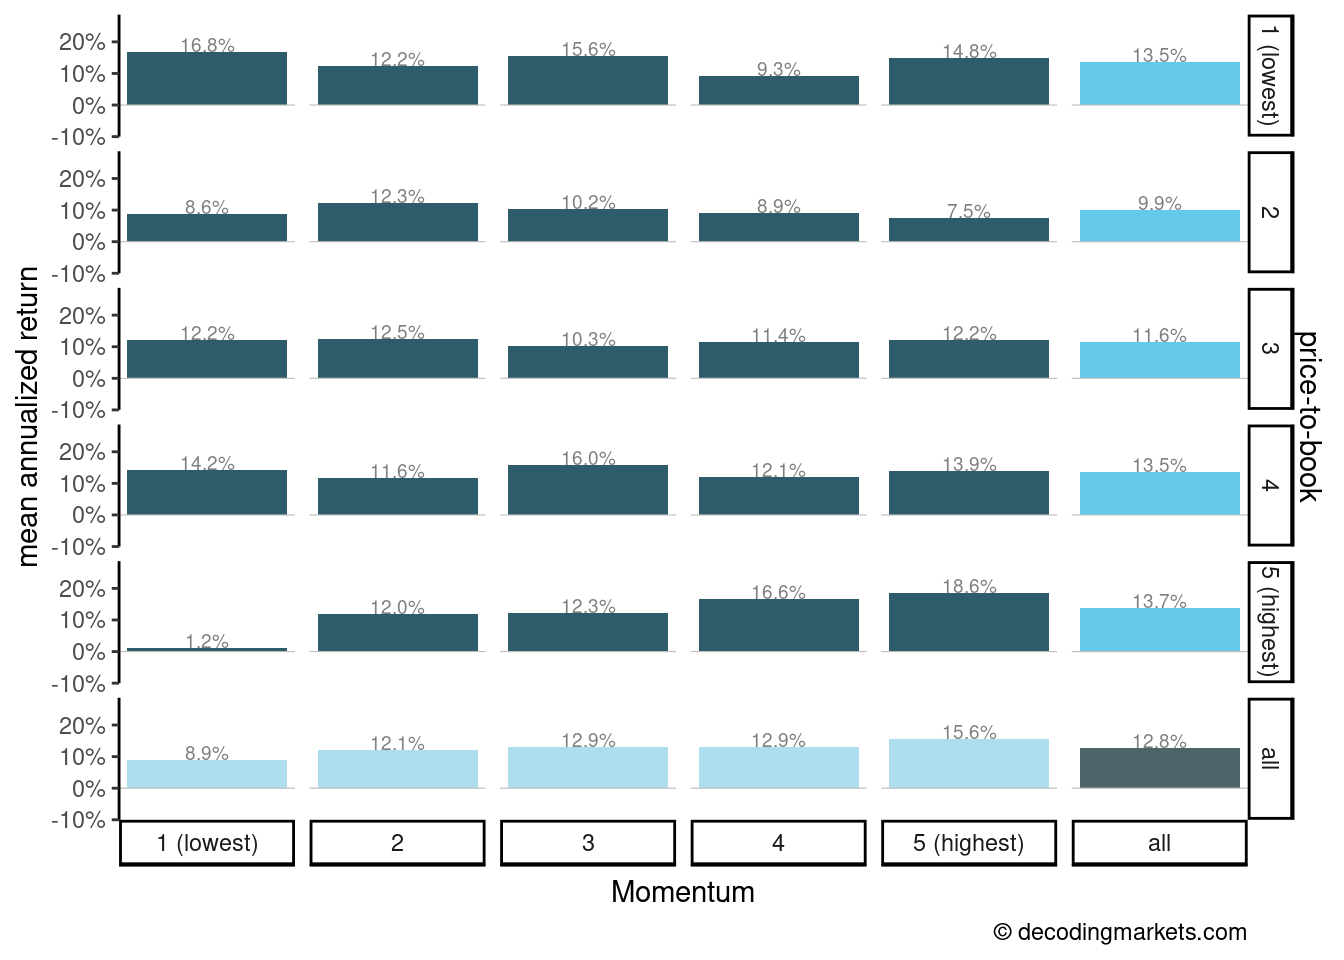
Below is a similar plot for price-to-book ratio. Interestingly, the clear momentum benefit only appears in high price-to-book stocks (“growth stocks”). This could be explained by these companies being more dependent on rumors and news:
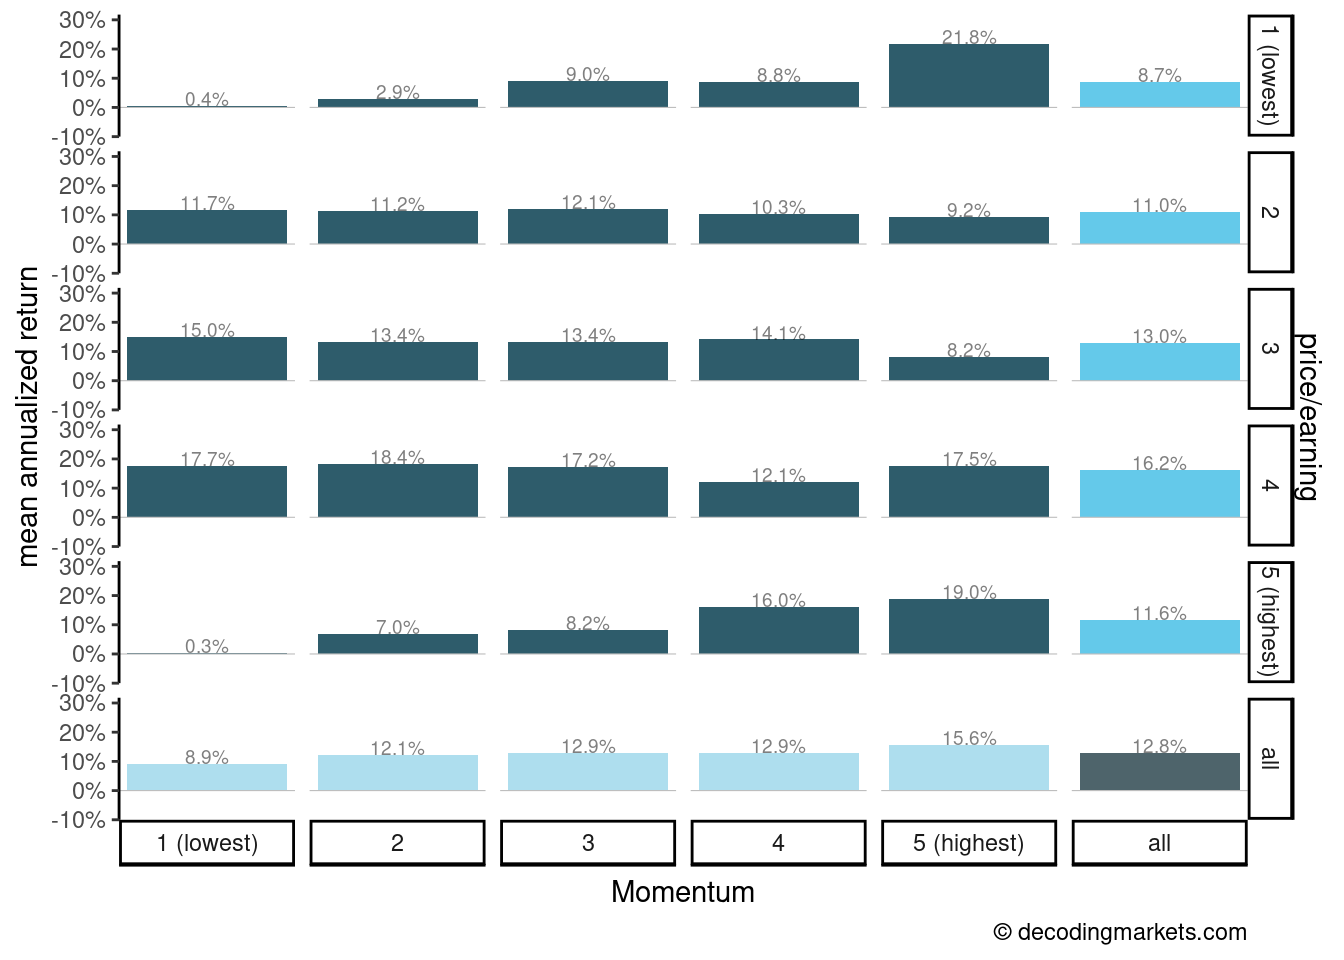
Sorting by the P/E ratio, we observe that momentum works in both extremes: the lowest P/E ratio stocks and the highest P/E ratio stocks. Mid-range P/E stocks seem to be mostly unaffected by the momentum effect. The reason is likely that high P/E stocks (again “growth”) are highly dependent on news etc. But the same applies to low P/E stocks, which are basically low-valued stocks (“cash cows”) with an uncertain future. The price recovery of such low P/E stocks is often gradually trending, therefore making them interesting for momentum trading.
Furthermore, we checked the price-to-sales ratio in relation to momentum. There, a high price to sales is best for momentum, while low price to sales shows an inversed pattern (mean reverting).
Relative to different company sizes, we found that the large caps have a clearer momentum pattern in terms of difference in returns (lowest vs. highest momentum). However, small caps deliver higher absolute returns.
Strategy Backtests
Let’s use the findings to build some improved momentum trading strategies. The baseline strategy is to invest equal amounts in the top-25 winning stocks of the past 12 months (excluding the very last month). The rebalancing is done monthly.
In the improved strategies, we filter to only use the top-20% of a certain fundamental ratio (for example P/E) and select the top-25 momentum stocks from these. The fundamental ratios are lagged from the prior month (don’t use repainting indicators in a backtest).
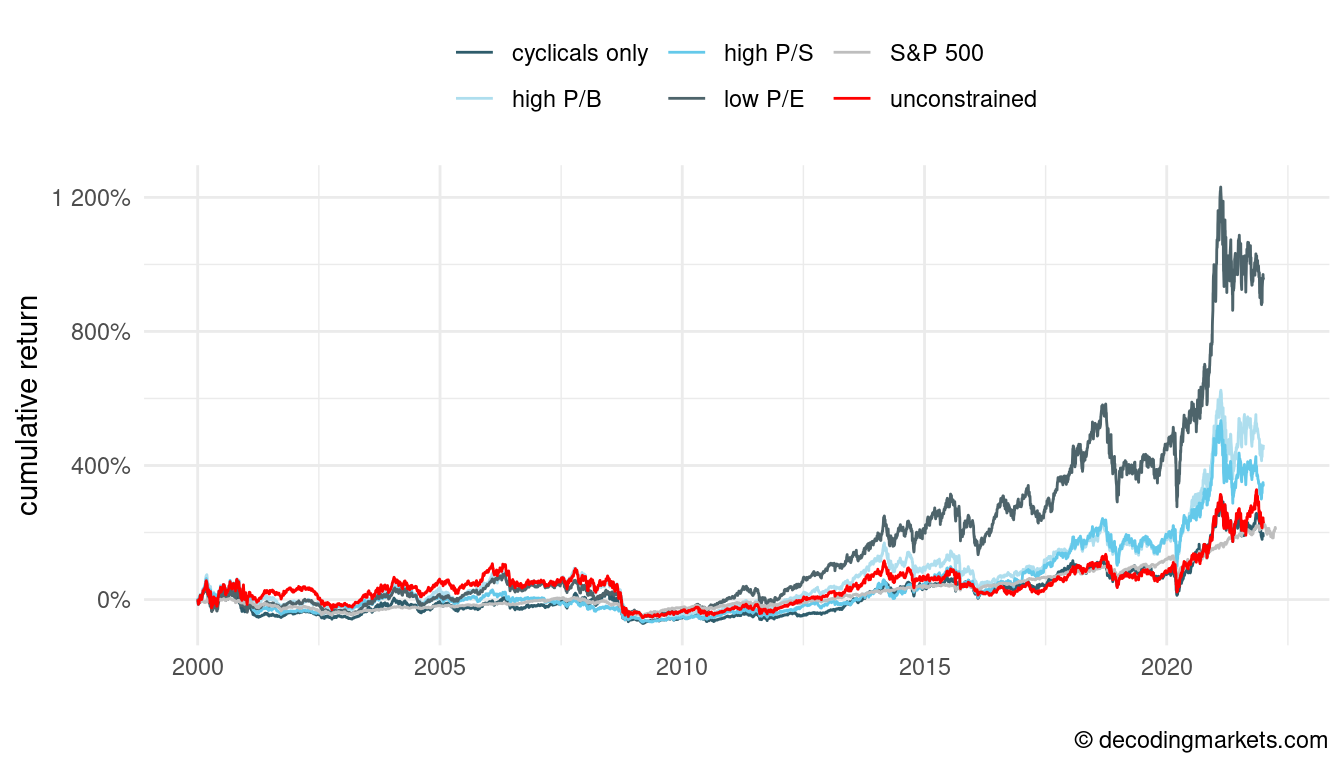
We see that momentum plus low P/E delivered the highest returns overall by quite a large margin. This is something that we also discovered in our recent course Analysis of Entry Signals (Fundamentals).
High P/B and high P/S also did better compared to the unconstrained momentum.
Excluding defensive sectors (healthcare, consumer staples, utilities) we saw results in line with the unconstrained strategy, indicating that non-cyclicals don’t rank at the top in terms of momentum anyway.
As shown in the next chart, a momentum strategy combining low P/E with high P/B would have done even better.
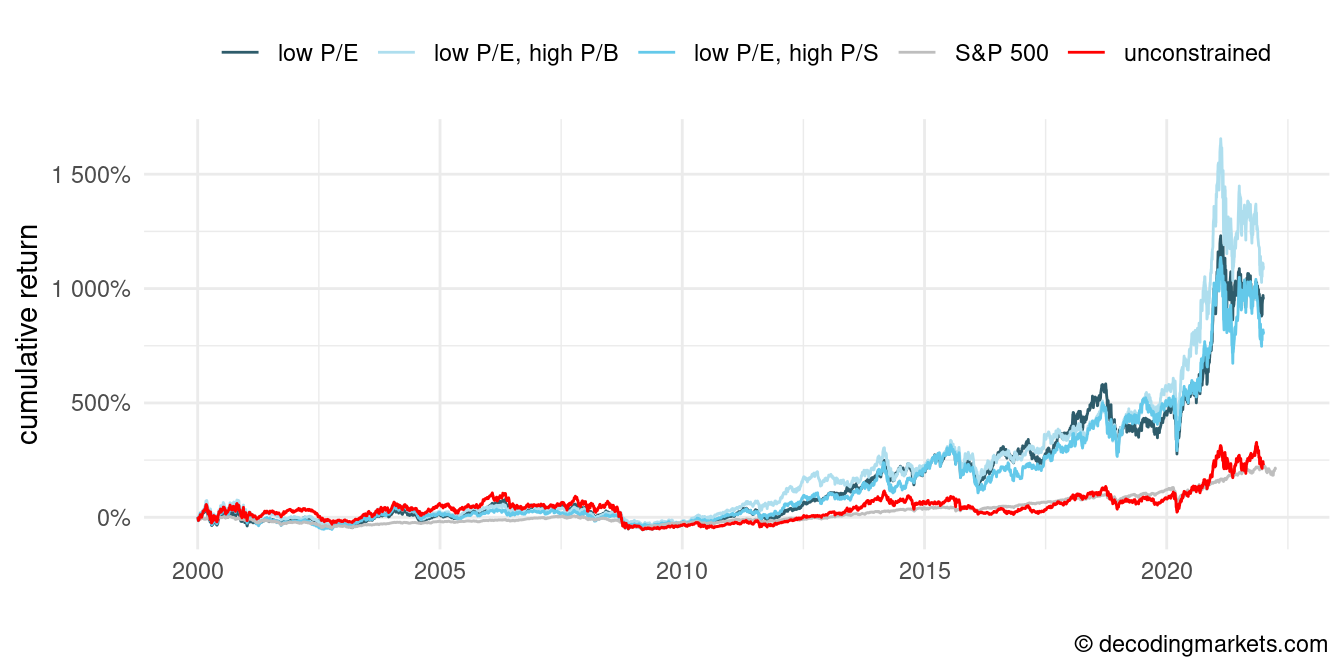
Obviously, while delivering a multiple of the performance of the market index such as the S&P 500, the returns are highly volatile. On the one hand, this is due to the relatively small number of equities (25), which does not give sufficient diversification to reduce the risk. On the other hand, and as explained earlier, momentum investing will often be biased towards high risk stocks.
A way to counter this would be to limit the investment universe to mid-range risky stocks (beta of around 1, so about the same as the S&P 500 index).
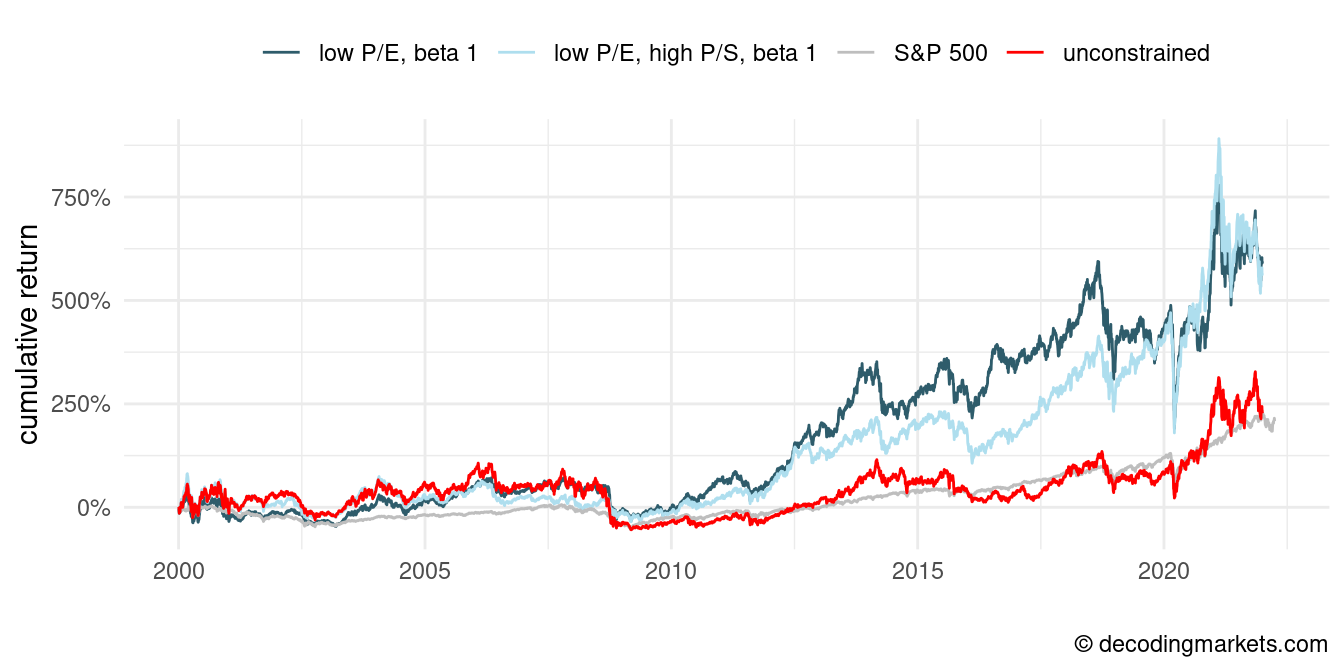
While this reduced the volatility (to about 25%), the drawdowns could not be avoided. Of course, there are other options to reduce volatility such as holding more positions (e.g. 50), using market timing filters or switching sectors.
Final Thoughts
There are many different ways to improve a momentum trading strategy. Using fundamental data looks to be a powerful way to add extra alpha to a pure momentum approach. Low P/E and high P/B trending stocks seen to fit well with a momentum based approach. In our course Analysis of Entry Signals we analyzed 22 different indicators and found similar answers.
When finding new patterns it’s crucial to ask questions about why something works or does not work. A solid theory is no guarantee that it something will work in the future (the theory might be wrong) but it at least reduces the chances of overfitting.