The concept of trend following is based on the belief that security prices move in upwards or downward trends over time and that the surest way to profit from those moves is to attempt to ride those trends.
Despite some claims that trend following is a strategy for nonconformists, trend following is in fact hugely popular, particularly among retail investors.
This popularity can be attributed to two factors.
Firstly, the widely documented success of trend followers in the 1970s and 1980s in books such as Market Wizards by Jack Schwager and Trend Following by Michael Covel.
Second, the simplicity of the approach. Advocates of trend following preach that to make money all you must do is ‘buy what is going up and sell what is going down’.
As it turns out, however, there is a lot more to successful trend following than is conveyed in such simplistic statements.
As we will see in the rest of this article, simply following the trend is not enough if you want to achieve the type of returns worth searching for.
Mistake 1. Not Knowing The Difference Between Trend Following Futures And Trend Following Stocks
The first issue we must address is that of the differences between trend following futures and trend following in stocks.
It should be noted that there is overwhelming evidence of successful trend following in futures markets, perhaps more so than in stocks.
The majority of the trend followers profiled in the original Market Wizards book were trading diversified baskets of futures contracts. As well, the professional managed futures space is made up of many trend following focused funds with billions of dollars under management.
Trend following in futures works because traders are able to spread their bets across a diverse range of assets. This allows them to jump on board the trends and attempt to capture the long tail of market returns.
The strategy is shown to do well in periods of volatility (such as 2008) and it provides the extra benefit of being less correlated to traditional investment strategies such as long only stocks.
However, there are many details that need to be addressed to follow trends in futures successfully. Risk is set according to various factors, correlation matrices are used and long-short balances are carefully analysed. A good book that details these settings is called Following The Trend.
This is to say that jumping in to the futures markets with an untested trend following approach is never going to work well. The best trend following funds achieve quite modest returns these days but these returns are only possible with a carefully constructed system.
Stocks
Trend following in stocks, meanwhile, is disadvantaged by the high correlation between individual companies. When the stock market as a whole goes down, most stocks go down with it. This is why some practitioners claim that trend following does not work on stocks.
Instead, they give it another name – momentum. Like trend following in futures, momentum has a long history of success. The principle is the same though. Buy stocks that are going up and sell those that are going down.
However, as we shall see, the devil is once again in the details.
Mistake 2. Focusing Only On Short Term Trends
Often, a trader will read about the benefits of trend trading and think that it applies to all time frames equally.
Unfortunately, all time frames are not equal and possibly the biggest mistake that new traders make is focusing on short-term time frames only.
It’s not that trends are missing from short-term charts necessarily. Rather, it’s simply more difficult to extract profits from these trends due to whipsaws and transaction costs. More experienced traders know that longer term trends provide better risk:reward ratios and are more profitable overall.
To show this is true consider the following equity curve. This equity curve is based on a strategy that buys stocks from the US S&P 1500 universe after a new 20-day high and sells after a new 5-day low. The portfolio size is set to 10 positions and in case of duplicate signals the strongest stock over 20 days is preferred.
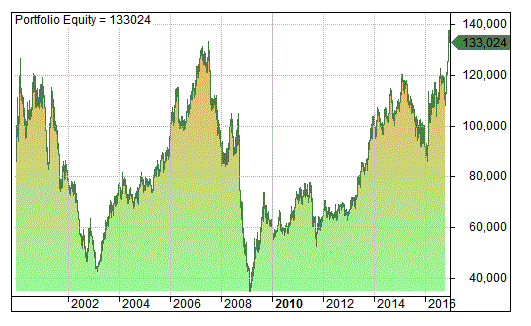
As you can see, the equity is erratic and performance is poor. Annualised return was only 1.69% with a maximum drawdown of -74%. This compares to a buy and hold performance on SPY of 4.51% with a drawdown of -55% over the same period.
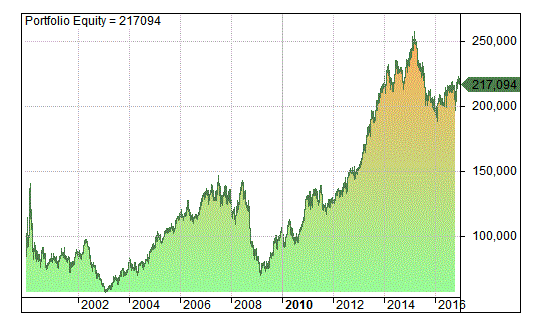
Now consider the next equity curve which is the same system but based on 200-day highs and 50-day lows. You can see that the system capturing the longer term trends is superior in this case. Annualised return is now 4.66%, roughly on a par with buy and hold.
Mistake 3. Not Understanding The Role Of Diversification
The next issue to look at is the performance of trend following on individual stocks rather than portfolios of stocks. In other words, the impact of diversification.
Some traders take the difficult path of picking just one or two trending stocks and hope that the individual momentum will be enough to give them standout returns.
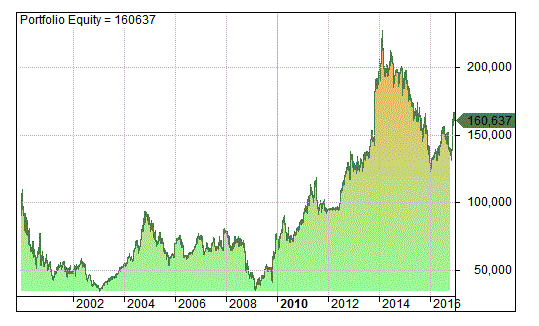
The following equity curve illustrates what can happen if you limit your portfolio to only one or two trending stocks.
In this case, the portfolio holds a maximum of two long positions at any one time. The strategy goes long after a new 200-day high and exits are made by 20% trailing stop. In the case of duplicate signals, the strongest stock over the 200 day period is preferred.
What went wrong?
As can be seen, restricting the portfolio to only two positions results in a very bumpy ride. Annualised return was 2.83% with a maximum drawdown of -61%. This is worse than buy and hold returns of 4.51% with a drawdown of -55%.
The results are heavily dependent on luck and suffer from a lack of diversification.
Mistake 4. Not Understanding The Long/Short Bias
Moving on, the following equity curve shows the results of the same trend following strategy as above, this time with a larger portfolio of 20 positions, 10 long and 10 short.
So we go long after a new 200-day high and we go short after a new 200-day low and we exit by 20% trailing stop. Duplicate signals are ranked by 200 day performance with strongest/weakest preferred for long/short trades.
As you can see from this equity curve, even with a larger portfolio of 20 positions you would have failed to perform well if you had held a significant number of short positions.
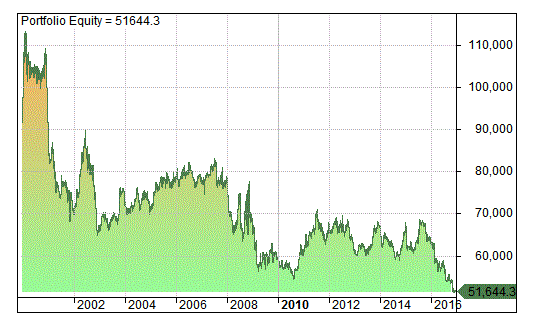
Between 2000 and 2017 on the S&P 1500 universe you would be looking at an annualised return of -2.66% and a maximum drawdown of -61%.
What Went Wrong?
The major thing that went wrong here is that we are trying to follow trends on the short side as well as the long side. Stocks have an upward bias/drift which means shorting is less profitable over longer periods.
Remove the short rules from our strategy and we see a much improved performance as can now be seen in the next chart. We are now holding 20 long positions and no shorts.
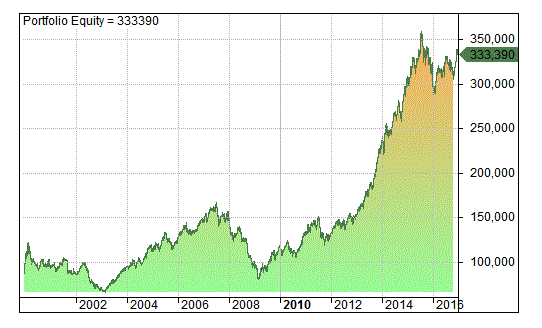
You can see that performance has greatly improved by removing short trades. Annualised return is now 7.34% and the maximum drawdown is -52%. We have beaten buy and hold of 4.51% but the returns are still nothing to write home about.
(Note that shorting is problematic for futures strategies too. Getting the right balance is a crucial component for all trend following systems.)
Mistake 5. Ignoring Market Conditions
The previous equity curve shows improvement but performance is still not much better than the buy and hold return. The glaring issue is that the strategy performs extremely poorly during the bear markets of 2002 and 2008.
Due to the high correlation between individual stocks it makes sense that a trend following strategy for equities is only going to do well during bull markets and not market declines.
Most practitioners get around this issue by employing a simple market filter that keeps them out of the market while the broader market is in decline. A simple indicator such as the 200-day moving average on the S&P 500 is often used.
Thus, the following equity curve shows the same strategy as before (200 day highs, 20% trailing stop, max 20 long positions) but this time with a market filter attached. Whenever the S&P 500 is below it’s 200-day moving average we are not allowed to take any new long positions.
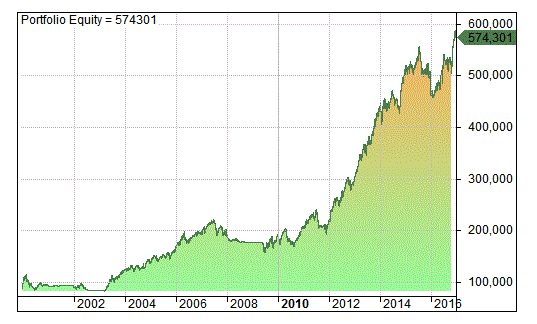
As you can see, including the market filter greatly enhances market returns and reduces risk. Annualised return is now 10.83% and maximum drawdown is -29%. The filter keeps the portfolio protected during painful bear markets.
Whether or not it will do so in the future is difficult to answer, however. A very sharp drop in the broader market, without any market signal is expected to be painful for many trend followers and momentum investors if it occurs.
Nevertheless, understanding the conditions of the market or market regime is a crucial component to a successful trend following system. In fact, the results suggest it could well be one of the most important components.
Conclusion
Some traders believe that a simple trend following approach is all that is needed to produce market beating returns. We have shown, however, that simply following the trend is not enough.
Many details must be taken into consideration in order to form a robust trend following strategy such as portfolio size, diversification, ranking mechanism and so on.
Without these details it is likely that any trading performance is heavily dependent on luck and unlikely to do better than buy and hold.
Note that in this article we have not even covered issues regarding smart ranking, the reliability of the data and the reliability of the back-test results which are also important issues to address.
Marwood Research
If you are interested in a trend following system for stocks that does take these details into account, you will find more than one in Marwood Research – Access All Areas.
Our research program is currently open at a discount price until midnight on Friday with the link above.
All simulations run using Amibroker using historical data from Norgate *. An average turnover (10-day) of $500,000 was used to weed out illiquid stocks and commissions were set to $0.01 per share to simulate costs. Position sizing was equal weighting method and all trades entered on next day open.
*Note that I just received a message from Norgate Investor Services mentioning that their NDU program is closing to beta users on 31 May and being rolled out commercially. Users may want to investigate what this means for their subscriptions.

Thanks for the great blog post JB! This is an awesome look at how trend following strategies apply to stocks – and what people need to be aware of when considering this approach. As a trend follower myself I definitely appreciate the nuances you mention, and will be sure to share this article going forward. Thanks again!
Glad you liked this one Jay, thanks a lot.
Great article with reliable source of information from a pro trader. That being said, its hard to apply mistake number 2, and 3 on a average retail trader like myself. Swing traders can really apply all 5 onto his/her trading strategies, which can lead to better profits. Not so much on the retail trader side a.k.a. day trader. Most of my trades are no longer than 30 to 50 seconds, because I believe to see momentum in stocks, you need volume, which can lead to activities which results in profits.
would add shorts only when the market is bearish. Possibly using 3 averages we can define the following “regimes”: bullish, neutral positive, bearish and neutral bearish using say 20, 50 and 200 day moving averages. For each state we would allow a maximum % of these 40 positions in long and short. Again, if bullish max 10% short, if bearish max 10% long, if neutral positive max 25% short etc. In this way we can keep the good of the overall trend in the market but taylor exposure to the actual state of that trend. I think that by giving a bit more colour to the definition of trend, we can get interesting results.
Yes, I think that is a good path to go down as long as we are careful not to over optimise. Do you have any evidence for your idea?