
The general advice with trading systems is that you should try to combine multiple trading strategies together in order to get the benefit of diversification.
Having a suite of profitable trading algorithms means that you can obtain a smoother drawdown and reduce your chance of having a losing day, week, month, year.
However, is it true that any trading strategy you include will help your overall returns?
In this article we will test a variety of different strategies and see the effects when they are combined together.
#1 Simple Momentum System
The first trading system we are going to look at is a simple momentum system called 5-Rule Momentum which is part of our Access All Areas package.
This system uses 5 simple rules to find medium-term trends in the S&P 500 universe.
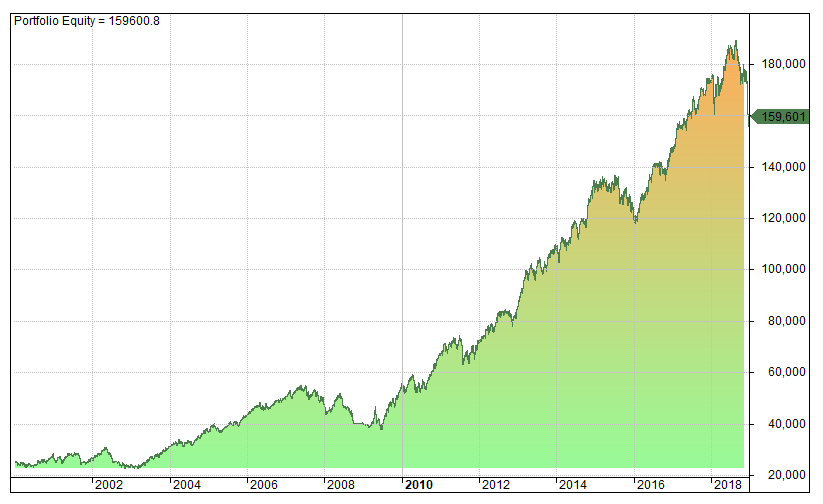
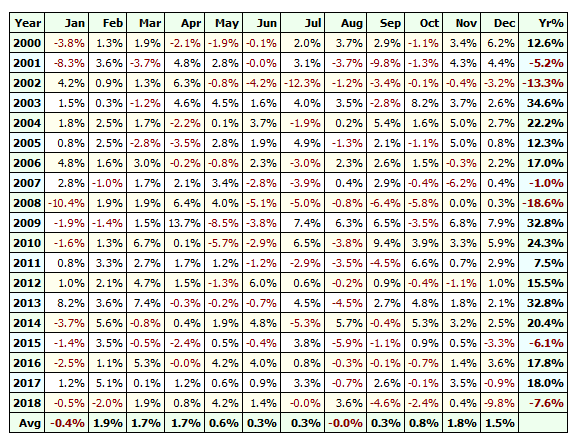
Backtesting this strategy between 1/2000 – 1/2019 with no leverage produced a CAR of 10.25% a maximum drawdown of -31.6% and a CAR/MDD of 0.32.
We achieved an upward sloping equity curve and had six losing years across the time period:
#2 Momentum Plus SPY
One easy test we can do is to see what happens if we combine the same momentum strategy above with a simple buy and hold strategy on the SPY ETF.
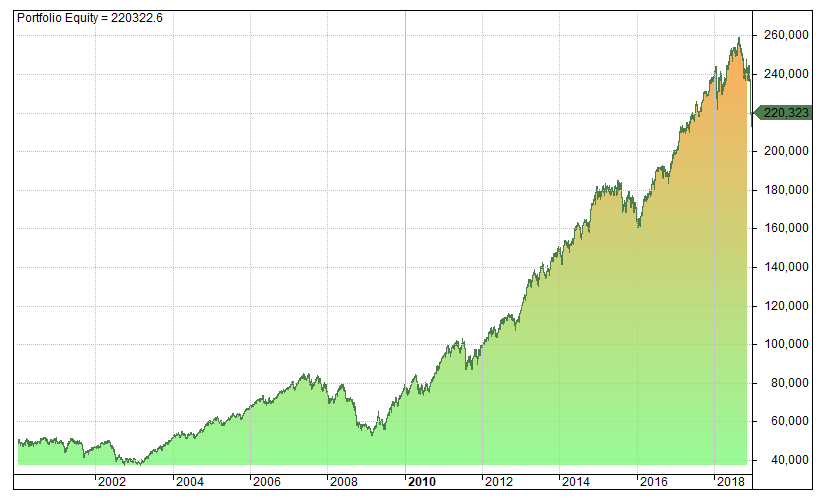
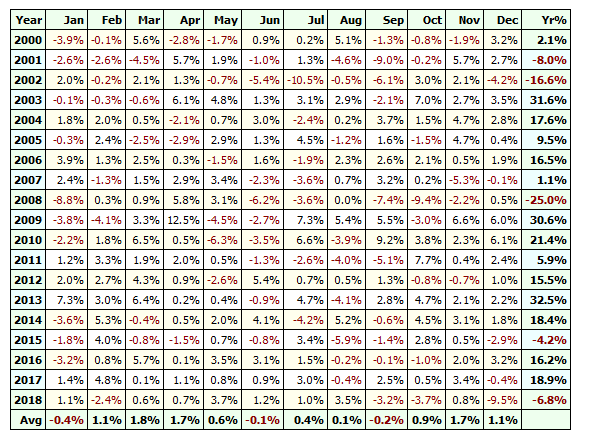
Allocating 50% of our equity to our momentum strategy and 50% to SPY produced a CAR of 8.12%, a max drawdown of -38% and a CAR/MDD of 0.21.
You can see that our returns have gone down and our drawdown has gone up by including SPY. Even though we had one less losing year it’s clear that buy and hold has done nothing to improve our overall portfolio.
This goes to show that not all investment strategies (even profitable ones) will improve a portfolio if they don’t have the right characteristics.
#3 Momentum Plus TLT
Next we can see what happens if we combine our momentum strategy with a 50% allocation to the TLT ETF. Since bonds have a low correlation to stocks this will hopefully act to smooth our returns.
Allocating 50% to our momentum strategy and 50% to TLT we produced a CAR of 8.31%, a max drawdown of -15.16% and a CAR/MDD of 0.55.
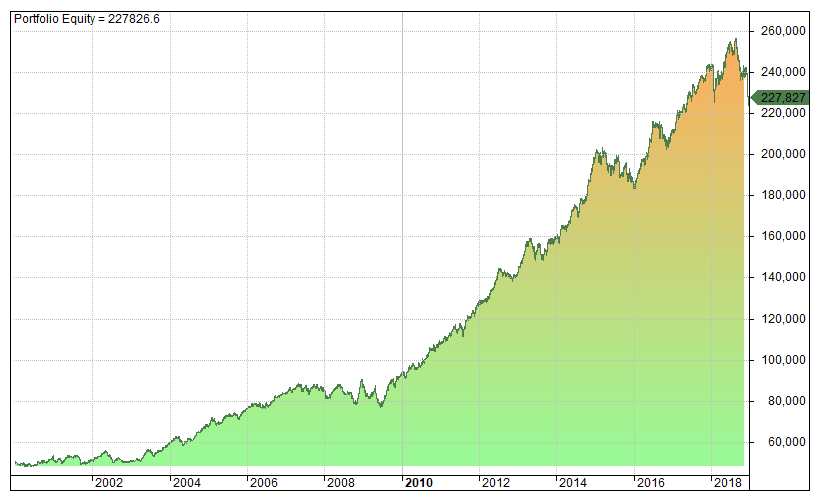
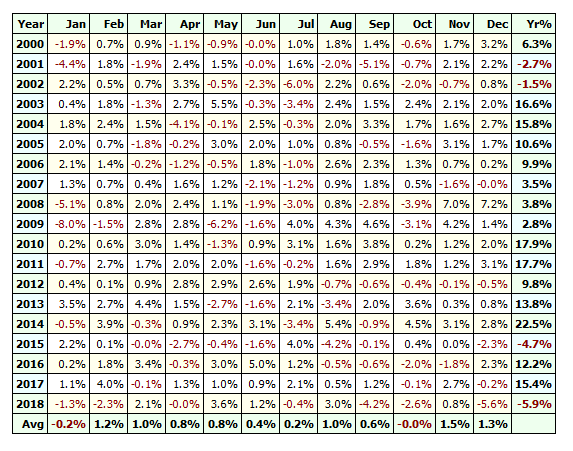
It’s fair to say that we have achieved a much smoother equity curve with the inclusion of TLT. Our drawdown is much more manageable at 15% and we have reduced our losing years to a total of four.
*It should be noted that TLT data goes back to 7/2002 so there is a period where the momentum system is on it’s own.
#4 Momentum Plus Mean Reversion
For our next test we are going to take the same momentum strategy and combine it with a 50% allocation to a mean reversion strategy called Bar Strength.
Bar Strength takes short term positions across a selection of 7 liquid ETFs; SPY, QQQ, TLT, VNQ, XLE, GLD and IEF. This strategy should therefore have a fairly low correlation to our momentum strategy. It is also available in Access All Areas.
Backtesting a 50% allocation to our momentum system with no leverage and a 50% allocation to Bar Strength produced a CAR of 9.64%, a max drawdown of -16.85% for a CAR/MDD of 0.57.
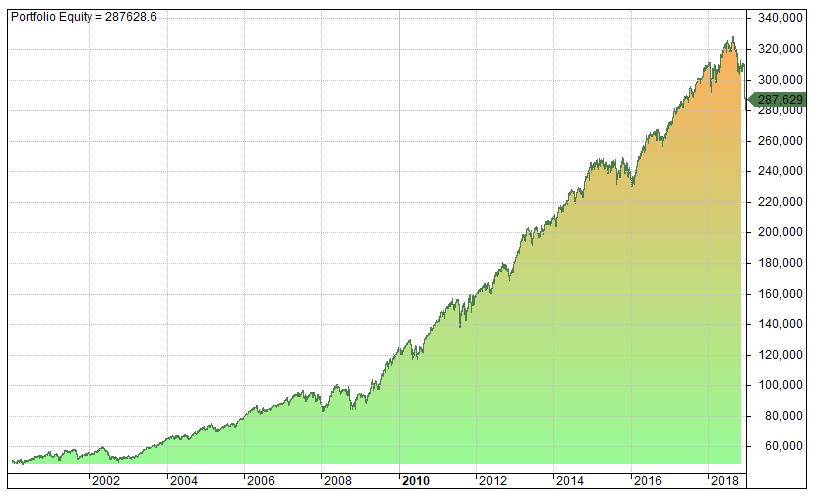
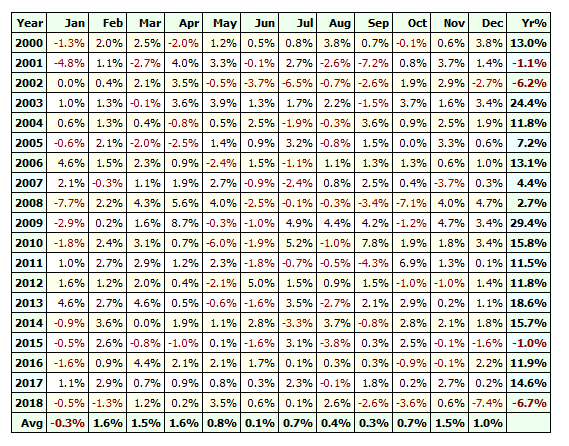
Thinking back to our initial momentum test, you can see that our return has now dropped from 10.25% to 9.64%. However, our maximum drawdown has almost halved from -31.6% to -16.85%.
#5 Momentum Plus Mean Reversion Plus Intraday
For this test we will combine our momentum and mean reversion systems with an intraday system called Morning Trend.
Morning Trend takes short-term positions in SPY and TLT and typically holds trades for five hours. This strategy was published to our program in April and also shows potential on some other tickers like TSLA and SPXL.
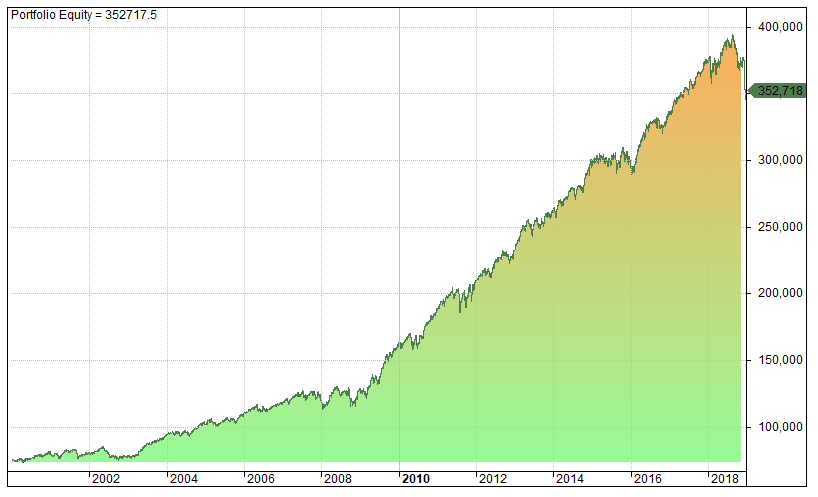
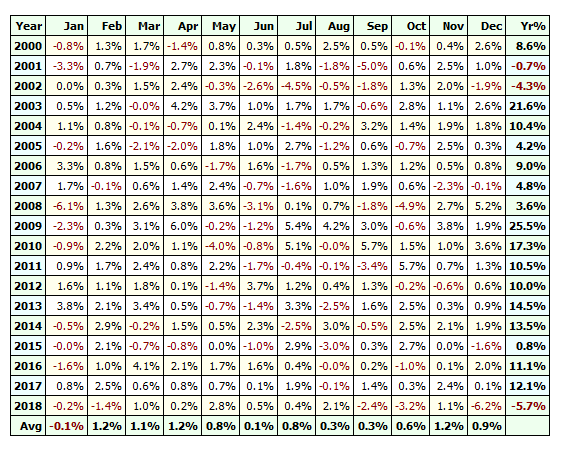
Allocating a third of our portfolio to our momentum system, a third to our mean reversion system and a third to our intraday system produced a CAR of 8.49%, a max drawdown of -12.45% and a CAR/MDD of 0.68.
Our number of losing years has dropped to three although it should be noted that Morning Trend doesn’t kick in until half way through 2002:
#6 Momentum Plus Mean Reversion Plus Intraday Plus TLT
For our final test we will take the three trading strategies above and combine them with a buy and hold position in TLT.
Using an equal weighted 25% allocation for each system we produced a CAR of 7.86%, a max drawdown of -10.43% and a CAR/MDD of 0.75.
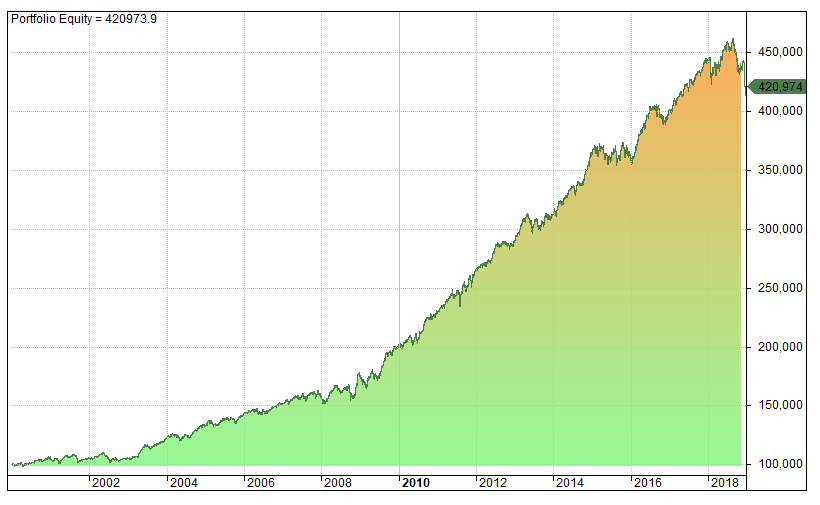
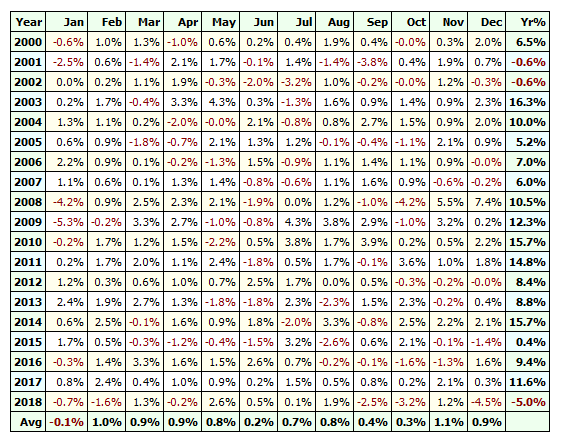
This is arguably the best result yet since we have achieved a CAR/MDD (also known as the MAR ratio) of 0.75.
Warnings & Considerations
So far we have seen some of the benefits of combining working trading strategies.
However, there are also some warnings and additional considerations to be aware of.
First, if you combine trading strategies that are not robust you will likely see no benefit and you could in fact compound your losses.
In other words if your trading strategies are curve fit then there is no use combining them because they will most likely be unprofitable systems.
The trading strategies shown in this article were published at different times so they each have different amounts of out-of-sample data behind them. They are are also backtested systems and not based on live trading. They are not guaranteed to continue to work in the live market.
Second, the equity curves on this page are based on daily close data so they do not take account of intraday drawdown. This probably isn’t a major issue but it’s something to be aware of when running your own tests.
[You can follow this link to see how I combine equity curves in Amibroker.]
Conclusions
I hope you can see from these examples that combining multiple trading strategies together can provide a lot of benefits.
The strategies we have shown are all long-only and yet we have been able to smooth our equity curve and reduce our drawdown to only ten percent.
The improved risk profile means that a trader could then seek to further boost returns through the addition of increased leverage.
Clearly, there are lots of possibilities for determining what type of strategies to combine, how many to hold in a portfolio and how to allocate capital.
It can be useful to calculate correlations but the best way to find out is to test.
Including different trading strategies into a portfolio test shows you the added benefits of each strategy and therefore how many additional strategies are optimal.
The goal is to find strategies that operate in such a way that they compliment each other.
Not all strategies are going to improve portfolio returns (as was seen when we added SPY buy and hold). But combining multiple trading strategies is a great way to capture diversification and boost risk-adjusted returns.
All charts produced in Amibroker. End of day data from Norgate. Intraday data from eSignal.

Thank you – nice to see some real figures (even if they are backtests).