This article looks at four Bollinger Bands trading strategies and tests some basic ideas using historical stock data.
Bollinger Bands are a useful and well known technical indicator, invented by John Bollinger back in the 1980s. They consist of a simple moving average (usually the 20 period) and two upper and bottom bands which are placed a number of standard deviations away (usually two).
They are thus able to capture 90-95% of a security’s price movement and they are the perfect vehicle for measuring volatility.
When the two bands are far apart, the stock or security is highly volatile, and when the bands are close together volatility is lower. Bollinger Bands are thus the basis for many different trading strategies such as the Bollinger Bands squeeze, the Bollinger Bands breakout, Bollinger Bands reversal and riding the Bollinger Bands trend.
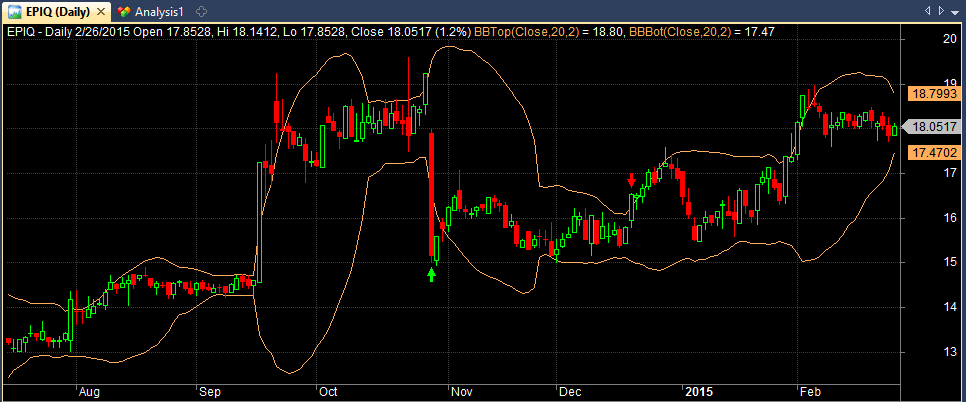
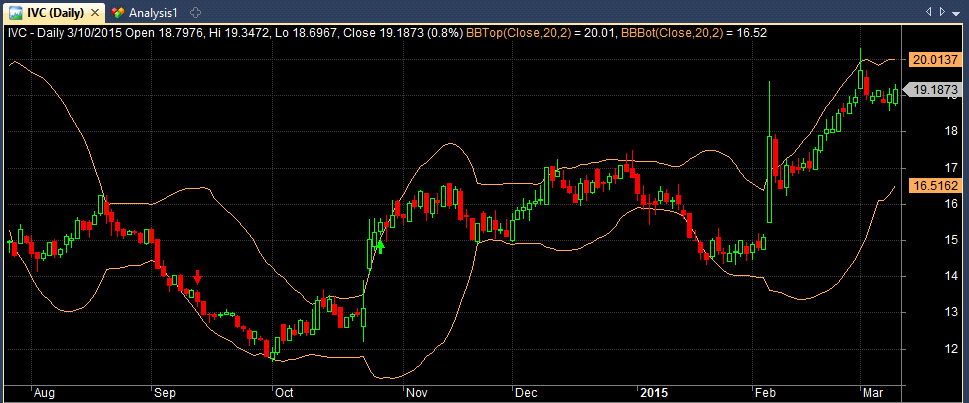
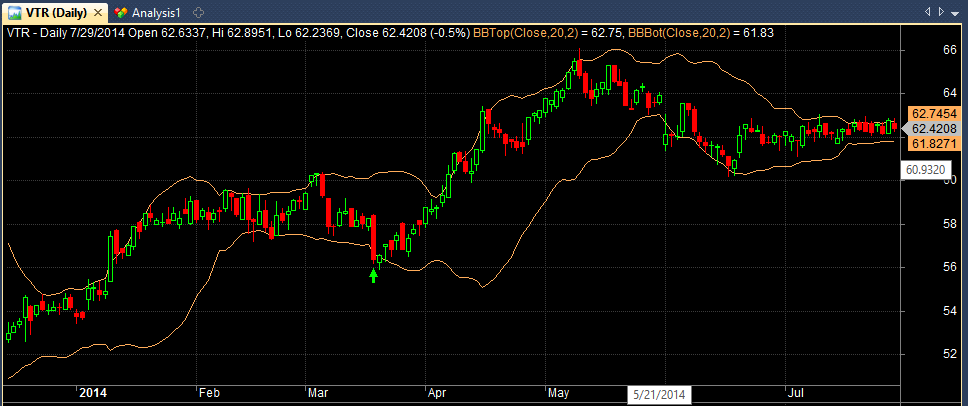
The next image shows the Bollinger Bands overlaid on a price chart with green and red arrows. This is a trade example taken from strategy number two, which you can read about below.
Bollinger Bands Parameters
As I mentioned above, the default is to use the 20 period simple moving average.
The upper band is then placed 2 standard deviations above the 20 MA and the lower band is placed 2 standard deviations below.
Of course, you are allowed to use any parameters you like, but you should remember that if you change the number of standard deviations to 2.1, the moving average period should change to 50. Likewise, if you change the number of standard deviations to 1.9, the moving average period should change to 10.
Bollinger Bands can be used on any timeframe and are useful for pattern recognition or combining with other technical indicators.
I like Bollinger Bands a lot, because they are excellent for measuring volatility and they can be overlaid on any time series not just a stock price.
Bollinger Bands can be used on volume, open interest, sentiment data, almost anything. They are therefore very flexible and allow traders a quick way to use standard deviations in their models.
Bollinger Bands Trading Strategy One
As I said before, Bollinger Bands are an excellent indicator but only if you use them correctly, and the inventor, John Bollinger, created a number of rules to guide traders as to how to use them. You can see the full 22 Bollinger Bands rules here.
One of the rules created by John Bollinger is:
8. Closes outside the Bollinger Bands are initially continuation signals, not reversal signals. (This has been the basis for many successful volatility breakout systems.)
In other words, if a security closes above the upper band you should see this as a breakout and go long. Conversely, if a security closes below the lower band you should go short.
The most common way to trade this strategy then, is to look for a close above the upper band or a close below the lower band. You then go long or short on the next open.
This is a strategy that is fairly easy to test on historical data.
Although there are many different permutations of markets, timeframes, and position sizing, the following simulation puts this simple strategy to test on the S&P 500 Index (SPX).
Test One Rules:
• When SPX closes above the upper Bollinger Band go long on the next open
• When SPX closes below the lower Bollinger Band go short on the next open
• Exit position by 15% trailing stop
Settings:
• Timeframe: Daily (EOD quotes)
• Start/ End dates: 1/1/1990 – 1/1/2015
• Starting capital: $100,000
• Position size: Fixed: $20,000 per trade
• Commission: $0.01 per trade
Test One Results:
To recap, this strategy goes long whenever the S&P 500 Index closes above it’s upper Bollinger Band on the daily chart and does so on the next open. It goes short on the next open whenever the index closes below it’s lower band.
The system risks a fixed amount of $20,000 on each trade and exits a trade by 15% trailing stop. As you can see, the results from this simple strategy on the S&P 500 Index are less than impressive:
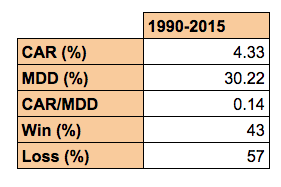
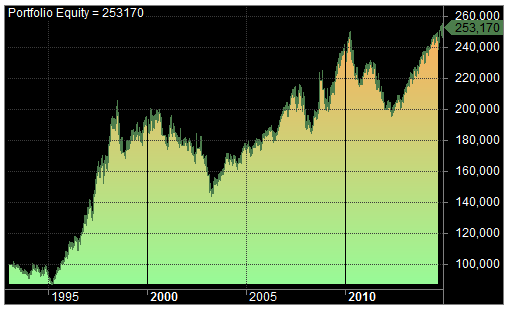
There is a compounded annualised return of just 4.33% between 1990 and 2015 with a maximum drawdown of 30%.
This compares to a buy-and-hold return of 7.29%* per year with a maximum drawdown of 57%.
When short positions are taken out and the system is run long only, the performance improves, to 5.41% CAR with a drawdown of 22%.
Unsurprisingly, these results are not spectacular, but they are actually better than I was expecting. Different permutations, different markets, timeframes, risk, might help make this into a simple and worthwhile model.
Bollinger Bands Trading Strategy Two
As mentioned earlier, Bollinger Bands can be used in many ways and you could write a whole book just about Bollinger Bands strategies alone.
One simple strategy comes from this article on the finance site Investopedia and it’s basically the reverse of strategy one.
The idea proposed in the article is simply to wait for a stock to close below the lower Bollinger Band and then buy it the following day. The exact sell criteria is not shown so I will assume that we exit the stock when the reverse occurs. i.e. when the stock closes above the top Bollinger Band.
According to the article, I’ve included a maximum loss stop-loss of 30%.
To test this strategy I have also included some extra liquidity rules (so that we avoid thinly traded penny stocks), a ranking rule (in order to choose between signals) and a market timing rule (so that we do not trade during a bear market). In addition, we will spread risk so that we can hold up to 20 positions at one time.
The system is run on historical data for stocks in the S&P 1500 universe between 2000 and 2015. This data includes delisted tickers and is adjusted for corporate actions.
Here are the full rules and then results:
Test Two Rules:
• If a stock closes below the lower Bollinger Band, buy the following day on the open
• Rank stocks by RSI(20). Choose lowest ranked signals first
• If the stock closes above it’s upper Bollinger Band, exit position on the next open
• Maximum loss stop loss of 30%
Settings/conditions:
• Long only
• Liquidity rule: 20 day average volume > 100,000
• Liquidity rule: Open price > $2
• Market Timing rule: SPX is above it’s 80 day MA
• Portfolio size: Max 20 positions
• Universe: S&P 1500
• Timeframe: Daily (EOD quotes)
• Sample: 1/1/2000 – 1/1/2015
• Starting capital: $100,000
• Position size: 5% per trade.
• Commission/slippage: $0.01 per trade
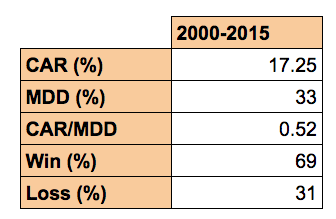
As you can see from the results of the test, the strategy was able to return 17.25% between 2000 and 2015 with a maximum drawdown of 33%.
The high win rate of this strategy makes it appealing and the idea looks to have potential. It must be noted, however, that the results do depend on getting good price fills on the open. I tested the strategy again using the buy price as half-way between the open and the high, and the sell price as half-way between the open and the low, and the annualised return dropped to 3.46% with 42% drawdown.
To improve this system I would suggest looking more closely at the entry price and ranking mechanism.
Bollinger Bands Trading Strategy Three
Going back to our simulator and looking again at our 22 rules, rule number seven is this:
7. In trending markets price can, and does, walk up the upper Bollinger Band and down the lower Bollinger Band.
This is a bit trickier to model using the simulator. But it is possible to come up with a strategy by specifying the number of higher opens or closes above the upper band. Or by the number of lower opens or closes below the lower band.
This next strategy goes long a stock when it closes above the upper Bollinger Band for two days in a row. This is a portfolio strategy using stocks from the S&P 1500 universe. The strategy uses the open price to calculate the default Bollinger Band parameters (20,2) and trades are entered on the same day close.
The system uses a market timing filter so only trades when the overall market (SPX) is above it’s 90-day MA. And it uses a liquidity filter to avoid thinly traded penny stocks and the like.
The system is run on in-sample data first then out-of-sample.
Test Three Rules:
• Buy a stock on the close if it closes above it’s upper Bollinger Band (calculated with open price) for the second day in a row
• Rank stocks by RSI(20). Choose lowest ranked signals first.
• Exit position with 30% trailing stop
Settings/conditions:
• Long only
• Liquidity: 20 day average volume > 100,000
• Liquidity: Open price > $2
• Market Timing: SPX is above it’s 80 day MA
• Portfolio size: Max 20 positions
• Universe: S&P 1500
• Timeframe: Daily (EOD quotes)
• In Sample: 1/1/2002 – 1/1/2012
• Out-of-sample: 1/1/2012 – 1/1/2015
• Starting capital: $100,000
• Position size: 5% per trade.
• Commission: $0.01 per trade
Test Three Results:
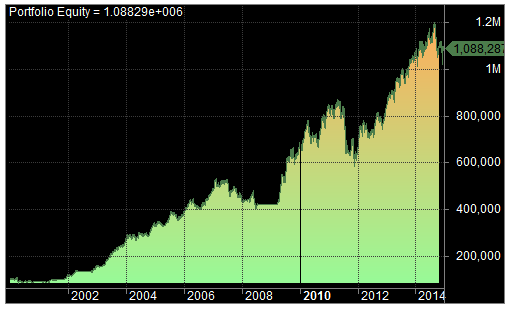
The results show a 16.44% annualised return with a maximum drawdown of 30% during the in-sample period and a 20.11% annualised return with a maximum drawdown of 15% during the out-of-sample period.
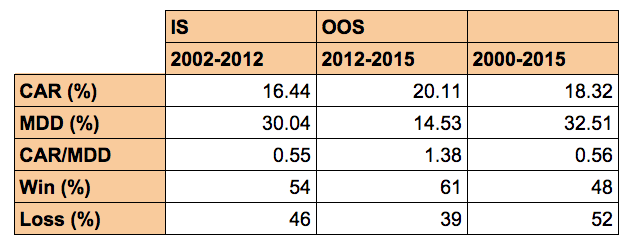
Essentially, this is a trend following strategy and it shows the strength of using portfolios when trading stocks.
One of the reasons why the strategy works well, however, is that it relies on trading on the close. To trade this system correctly, you would need to scan for potential candidates and buy right on the close.
This would not only include scanning by Bollinger Band – you need to be sure that the stock is going to close above the upper band which may not always be easy – but also by RSI, to take account of the ranking criteria. ( I tested the strategy using the prior day’s RSI and there was very little difference in result so this is another option).
If we run the test again, but this time we buy using the high price and not the close, the return goes down and the drawdown goes up, but not by a great deal. This might be a more accurate representation of the price fills we would actually get when trading the system.
Overall, the results are pretty good. With some decent tools and a little bit of discretion there may be some potential to be found here. Below is the full equity curve from 2000-2015:
Bollinger Bands Trading Strategy Four
In rule 6, John Bollinger states that:
6. Tags of the bands are just that, tags not signals. A tag of the upper Bollinger Band is NOT in-and-of-itself a sell signal. A tag of the lower Bollinger Band is NOT in-and-of-itself a buy signal.
But what if those tags occur when the stock is already in an uptrend? Maybe there is a possibility that a close below the bottom Bollinger Band could actually be a good time to trade the pullback?
In this next strategy, we use the same settings as test two except for two differences. We need the stock to be in an uptrend and we only exit by trailing stop.
Test Four Rules:
• Buy a stock on the close if it closes below it’s lower Bollinger Band
• Rank stocks by RSI(20). Choose lowest ranked signals first
• 20 day moving average must be higher than the day before
• Exit position with 30% trailing stop
Settings/conditions:
• Long only
• Liquidity: 20 day average volume > 100,000
• Liquidity: Open price > $2
• Market Timing: SPX is above it’s 80 day MA
• Portfolio size: Max 20 positions
• Universe: S&P 1500
• Timeframe: Daily (EOD quotes)
• In Sample: 1/1/2002 – 1/1/2012
• Out-of-sample: 1/1/2012 – 1/1/2015
• Starting capital: $100,000
• Position size: 5% per trade.
• Commission: $0.01 per trade
Test Four Results:
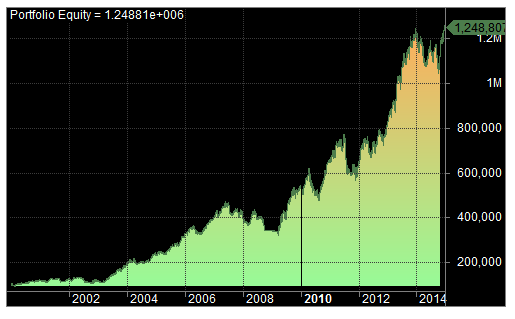
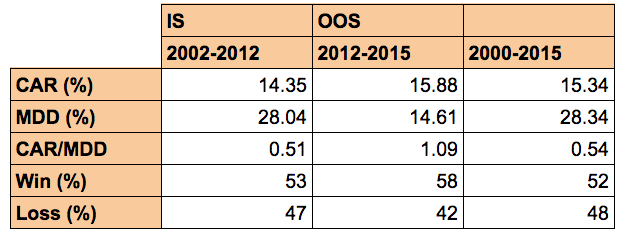
As can be seen below, the results are OK. Annualised return in the in-sample period was 14.35% with a drawdown of 28%. In the out-of-sample period, the annualised return was 15.88% with a drawdown of 15%.
Again, the strategy suffers from the problem of trading right on the close, so this strategy (and strategy three) might benefit from some discretion.
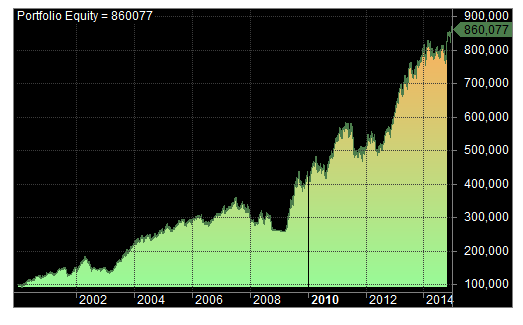
Here is the full equity curve between 2000 and 2015:
Conclusion
Overall, it appears that trading strategy three is the most appealing, based on the CAR/MDD ratio. However, the higher win rate of strategy 2 suggests that strategy 2 might also be worth investigating.
As mentioned, the problem of scanning for the right signals and trading them right on the close means that strategy three and four are relatively difficult to trade, at least without more expensive tools. Whereas trading strategy two relies on getting good price fills on the open.
Nevertheless, there appears to be potential in these systems for further development.


Wow this was great. Turns out I’ve been looking at BB bands wrong all along. Thanks for this, helped clarify quite a bit!!
Glad this article helped Andre, how were you using Bollinger Bands before?
I have been trading almost the exact opposite way they were intended haha I have been shorting on a close above and long on a close below.
However reading this post it makes so much sense as to why it wasent working.
I have also been picking break outs or break downs based on the tightening of the bands. So for example if price is above the 20ma and the bands start expanding then I’ll go long and vice versa. Works quite well but I haven’t back tested it throughly so I can’t accurately comment on how well it historically works.
This is the great thing about back-testing, seeing what works and what doesn’t so glad it’s helped!
There are so many different ways to use the bands. Trading the squeeze scenario, where the bands tighten, is definitely something to look into next as you are then trading volatility.
I use a longer term version of Strategy 3 with a 50 period BB. My filter is that 50 day SMA should be above 200 day SMA. Stop loss is a close below 200 day SMA. Works pretty well as a long term trend following system.
Effectively it is equivalent to a Golden Cross system (only long trades) with closes above the upper BB used as entry points.
Have read your book as well and got some pretty useful ideas from it.
Thanks!
That sounds like a solid strategy Ravi, I like it.
And I’m glad you got some useful ideas from the book. Keep reading this blog because I’ve got plenty more to share! Cheers and good trading.
Forgot to mention another filter, which is Bollinger Bandwidth below 20%. So looking to take advantage of the Squeeze as well