
Recently, I grabbed a book from my library that had been standing there for the past 10 years. It’s called Guide to the 50 Economic Indicators That Really Matter.
It’s one of the few books that describe concrete trading strategies that are still relevant. It’s also a great read to brush up on knowledge about economic indicators. Let’s talk about some of them.
Indicators Matter
In a typical macroeconomics class, we’re taught that gross domestic product (GDP) is made up of four components:
- consumption
- (capital goods) investment
- government spending
- net exports
Most indicators are used to predict one component of GDP ahead of time, e.g. automotive sales can tell us something about consumption, durable goods orders about investment etc.
Some indicators are leading, some concurrent, and some are lagging. Of course, as investors and traders our main interest are leading indicators. We want economic signals that precede a market plummet or rise.
A further criteria that makes a good indicator is that its signal-to-noise ratio is high. Indicators that have too much randomness have little meaning. An important trick (if possible) is to use the seasonally-adjusted version of indicators. Also, it’s better to look at the trend over several reporting periods instead of just a single observation.
In the following I’ve picked five indicators from the book and run backtests on the suggested trading strategies (or slight variations of them). Let’s start with…
#1 Automobile Sales
The car industry connects many parts of the economy, so their sales figures tell a lot about the health of the economy as a whole. For most people, the purchase of a vehicle is a major expenditure that requires borrowing money. Therefore, by looking at the number of cars sold, you get some view of people’s confidence in the economy and theirs willingness to spend.
The total vehicle sales numbers are published on the first Friday of the month for the previous month. We need to look at the seasonally-adjusted figure, as car sales follow an annual cycle with increased sales by the end of the year.
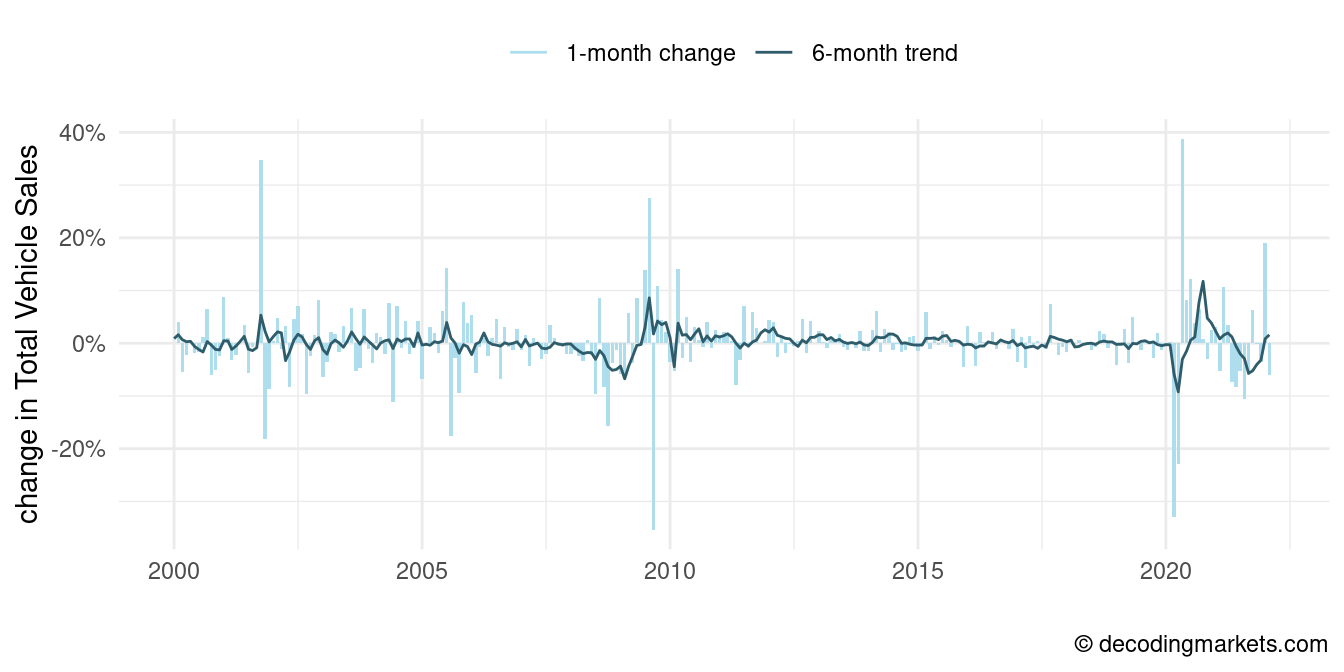
The strategy that shall be tested is fairly simple: As long as the past 6-month trend in vehicle sales is positive, stay invested in consumer discretionary stocks, replicated by the ETF ticker XLY (alternatively buy AAPL, HD, NKE, etc.). When the vehicle sales trend turns negative, rotate into long-term US treasuries (ticker TLT).
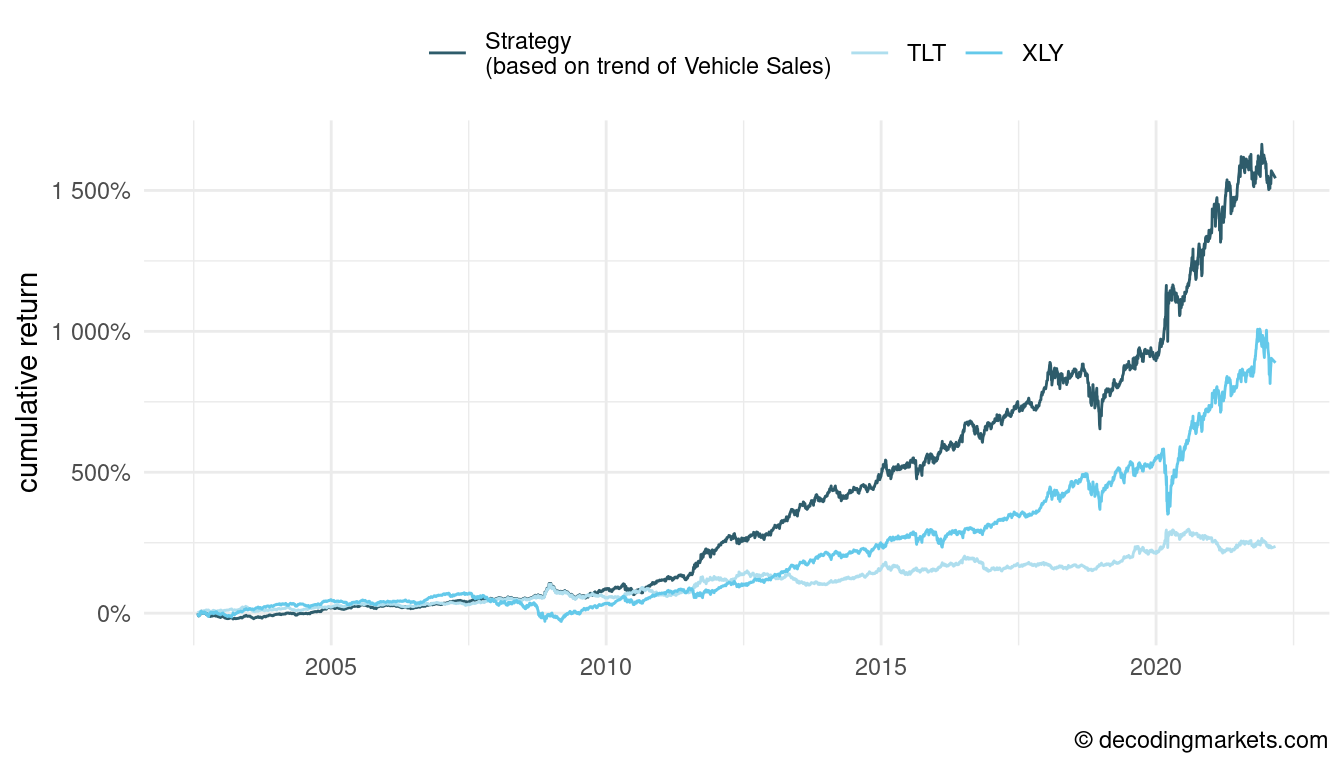
The vehicle sales turned out to be a strong signal to avoid drawdowns in consumer discretionary stocks. Following this strategy could have earned an extra 3% annualised while bearing a lower risk (Sharpe ratio of the strategy is 0.96 versus 0.59 for XLY since 2002).
#2 Retail Sales
Like vehicle sales, retail sales can give a hint about consumer confidence. Consumers are spending more when they think that their job is save and they will be able to pay off their credit card.
The Advance Retail Sales is an estimate that is based on data from a sample of retailers. Advance because it is published before the larger Monthly Retail Trade Survey, normally around the 15th of the following month.
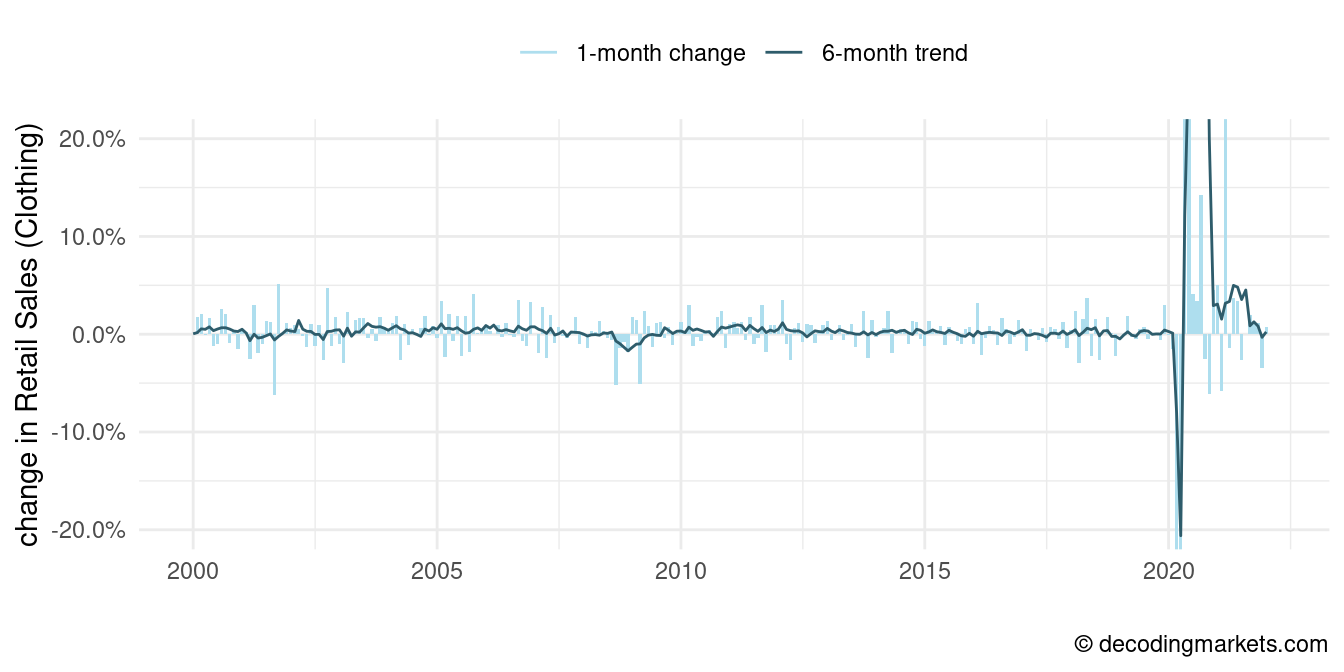
Below is a chart of the change in the Advance Retail Sales for Clothing and Clothing Accessory Stores (data link). Clothing is interesting as it represents to some extent impulsive retail purchases. Obviously, we see a huge major drop followed by a large increase during the early 2020 Covid pandemic.
Again it’s crucial to use the seasonally-adjusted numbers, as holiday shopping would completely distort the signal.
The strategy proposed is to buy retail stocks (ETF ticker XRT, but one could also pick individual stocks like JNW, DLTR, etc.) when the most recent one-month change in Retail Sales is up, and healthcare stocks (ETF ticker XLV) when it’s down.
This follows a simple tradeoff logic, when apparel sales are rising, retail should do well, but when retail sales decline, people will still be spending their money on health.
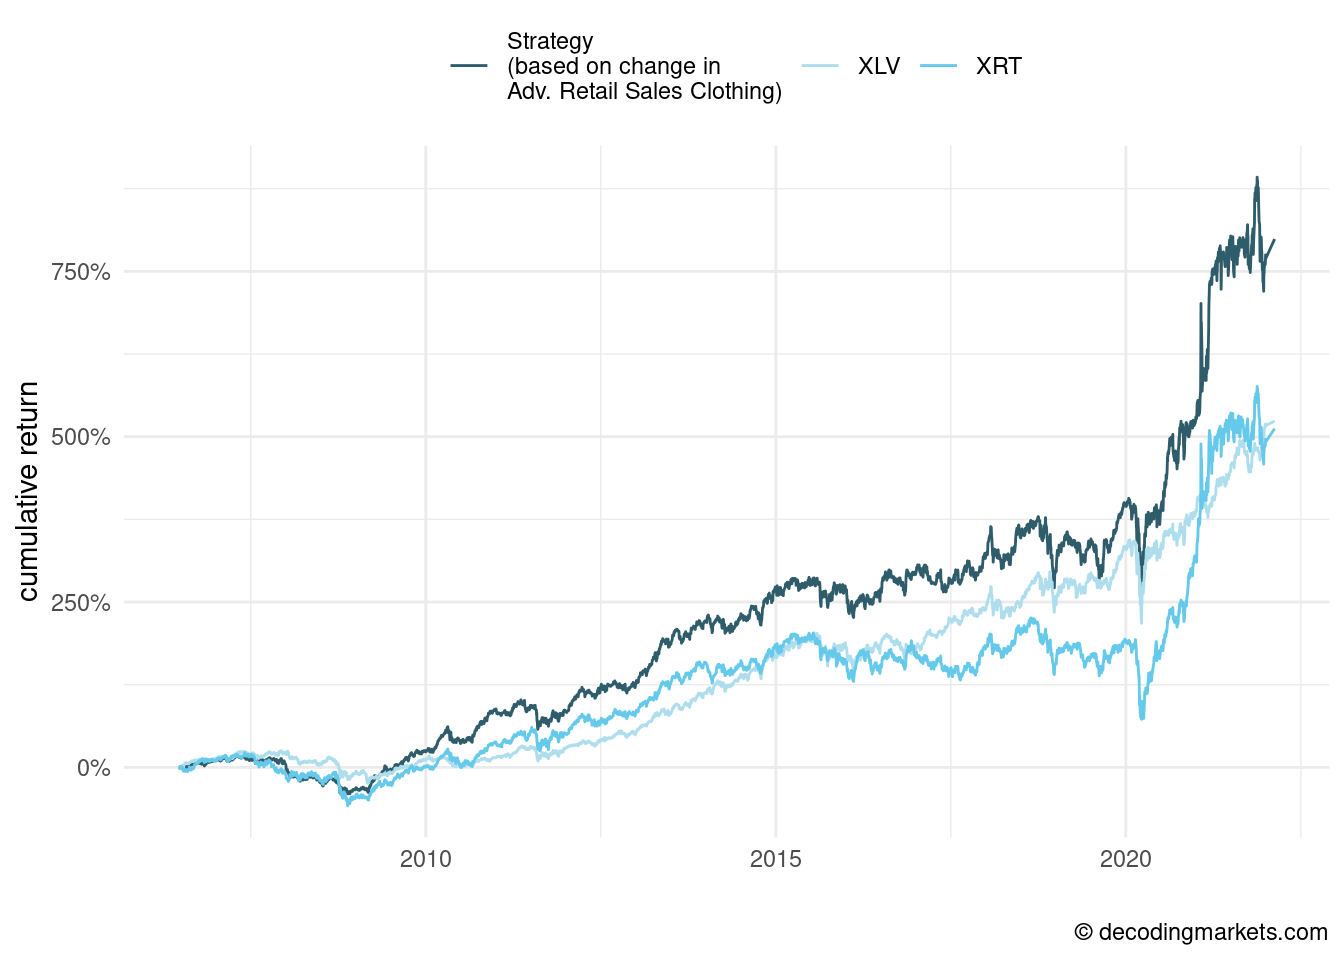
Using the change in clothing retail number, the strategy clearly outperformed both individual industries (strategy’s Sharpe ratio is 0.68).
#3 Slack or Underemployment
The monthly released unemployment figure is one of the most widely used and talked about economic gauges. However, raw unemployment is a very blunt measure in the sense that when it rises, the economic decline has already progressed substantially and stock markets would have anticipated that. One of the reasons is that this information is already released in the weekly jobless claims.
A much more interesting measure is the underemployment rate, also called the slack. This tells us how many people work part-time because of economic conditions.
An increase in the slack is mostly due to employers cutting labor costs, without actually firing the workers. The reason why employers reduce working hours rather than end contracts altogether is because the latter will be expensive when the time for rehiring comes, or if the business is hit less hard than expected. Why? Because most jobs require some training, on-boarding, and also the hiring procedure can be expensive.
As a result, underemployment tends to react ahead of unemployment, and also pulls back earlier. For a trader this can be the signal that it’s time to get back into cyclical assets.
Below is a chart of the US slack and unemployment numbers. The difference is subtle but it is there.
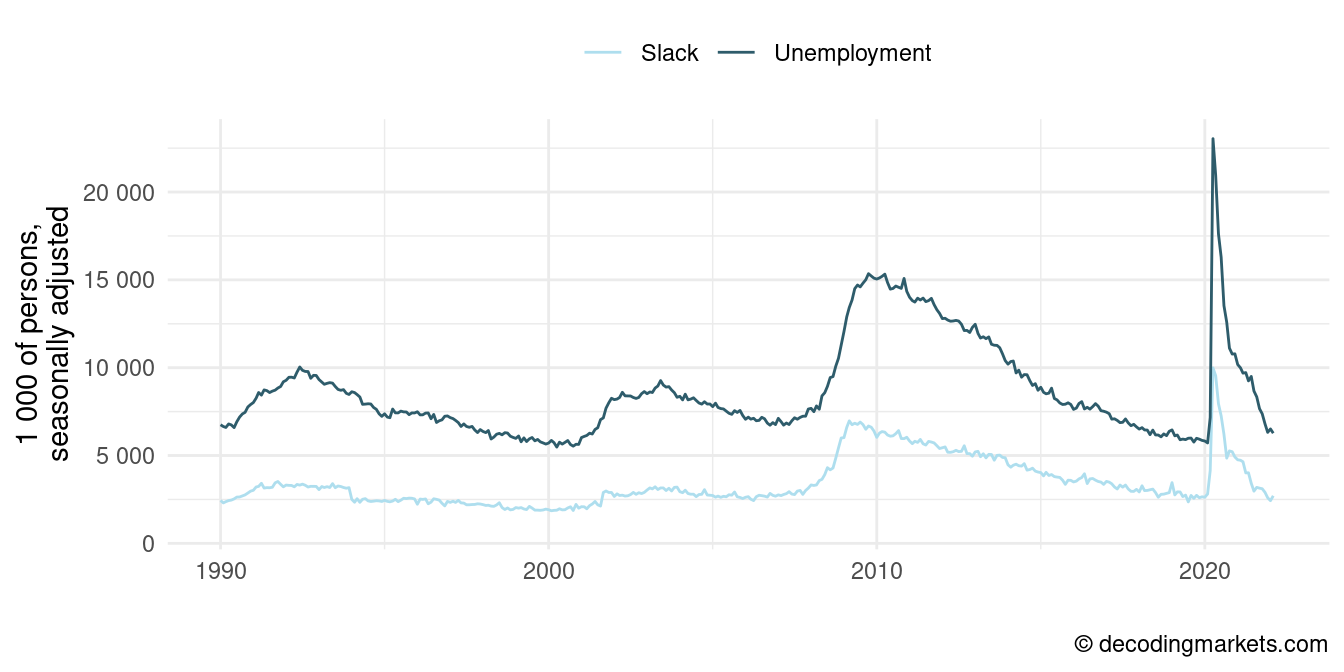
The strategy is again simple: If the 6-month rolling trend in slack is down, then go long on consumer discretionary stocks (ETF XLY). On the other hand, if the trend is positive, that is, more people are required to reduce their work schedules, then go long drug makers (IHE).
Why drug makers? It’s one of the anti-cyclicals that people revert to when they work less. Instead, one could also buy beer stocks (DEO, CCU, etc.) or home entertainment (DIS, NFLX, etc.).
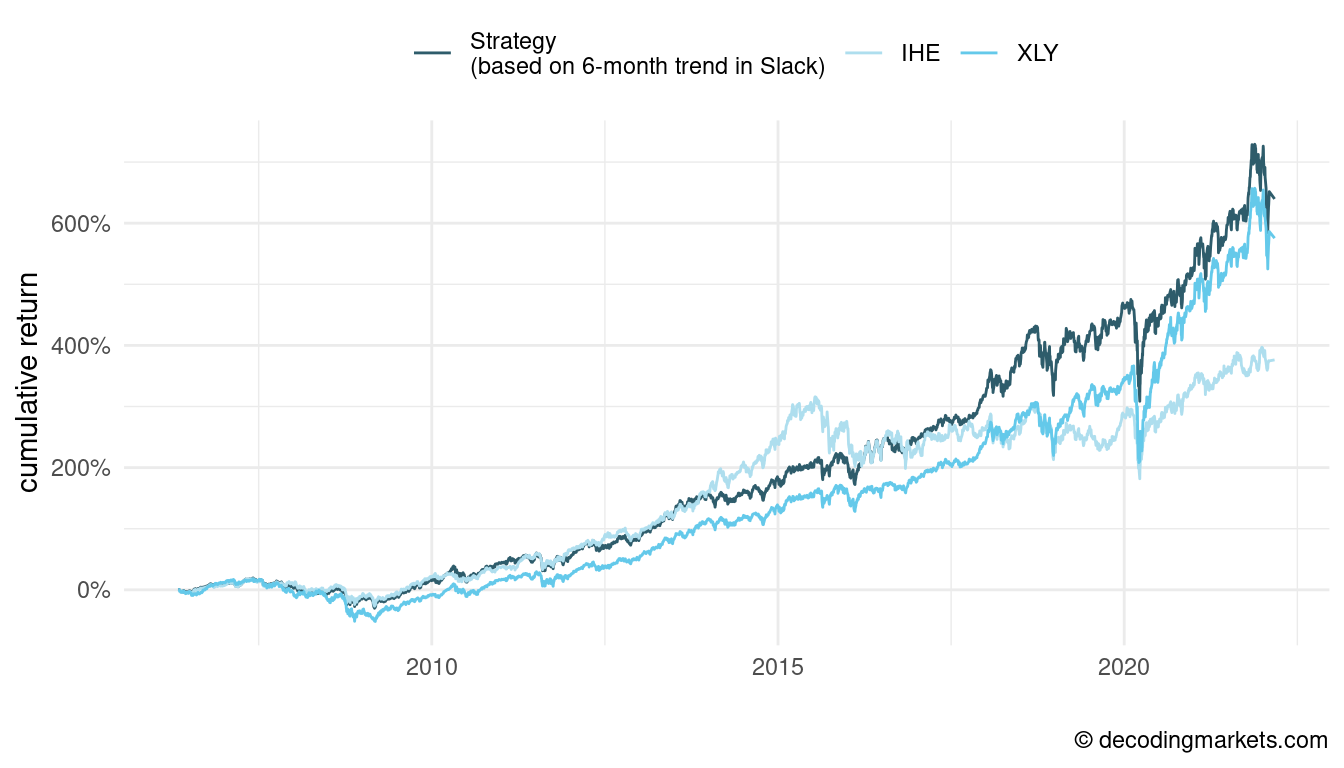
The strategy of rotating between IHE and XLY based on the 6-month slack performed better in both absolute performance and risk-adjusted terms (Sharpe ratio 0.71 versus 0.59 for XLY and 0.54 for IHE).
#4 Durable Goods Orders
How businesses are spending on machinery and equipment can help us understand the health of the economy ahead. At the end of every month, the U.S. Census Bureau publishes the Manufacturers’ New Orders of Durable Goods for the previous month.
We specifically look at the durable goods orders excluding defense, to avoid noise from major government spending.
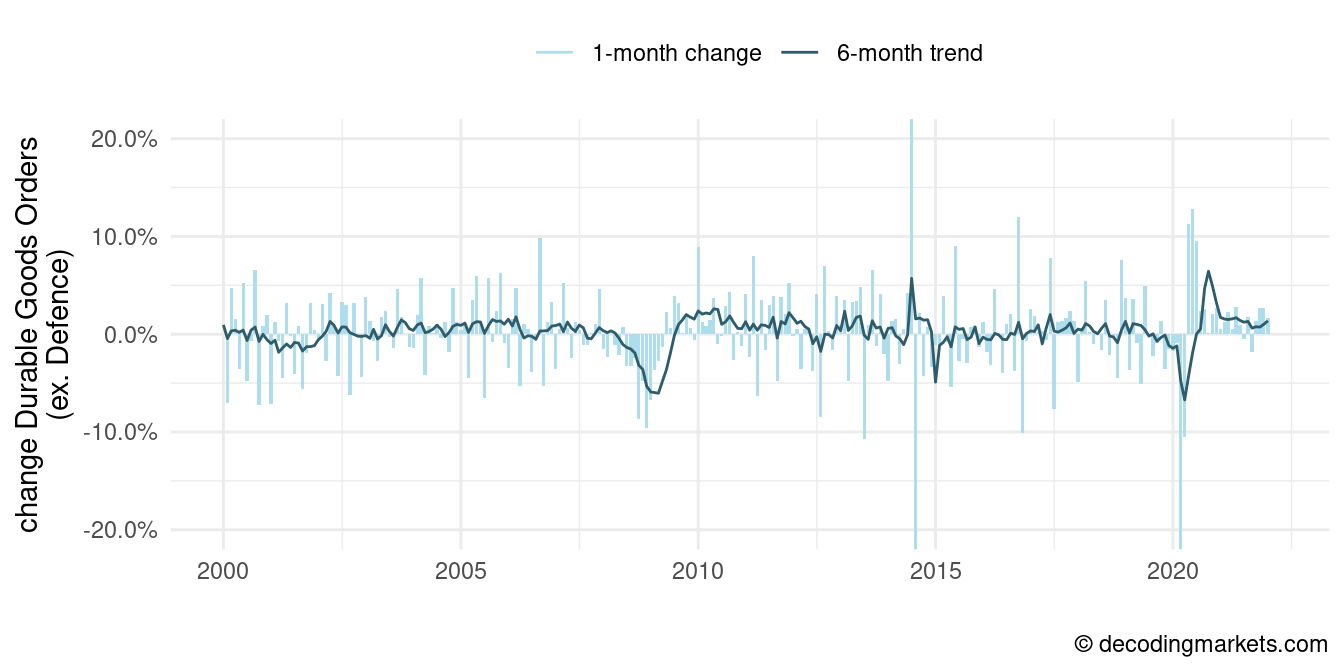
The strategy here is again straightforward: For as long as the 3-month trend in durable goods orders is positive, invest in industrials (ticker XLI, or alternatively in individual stocks like HON, GE, etc.). When the trend turns negative, then rotate into the broad stock market (SPY).
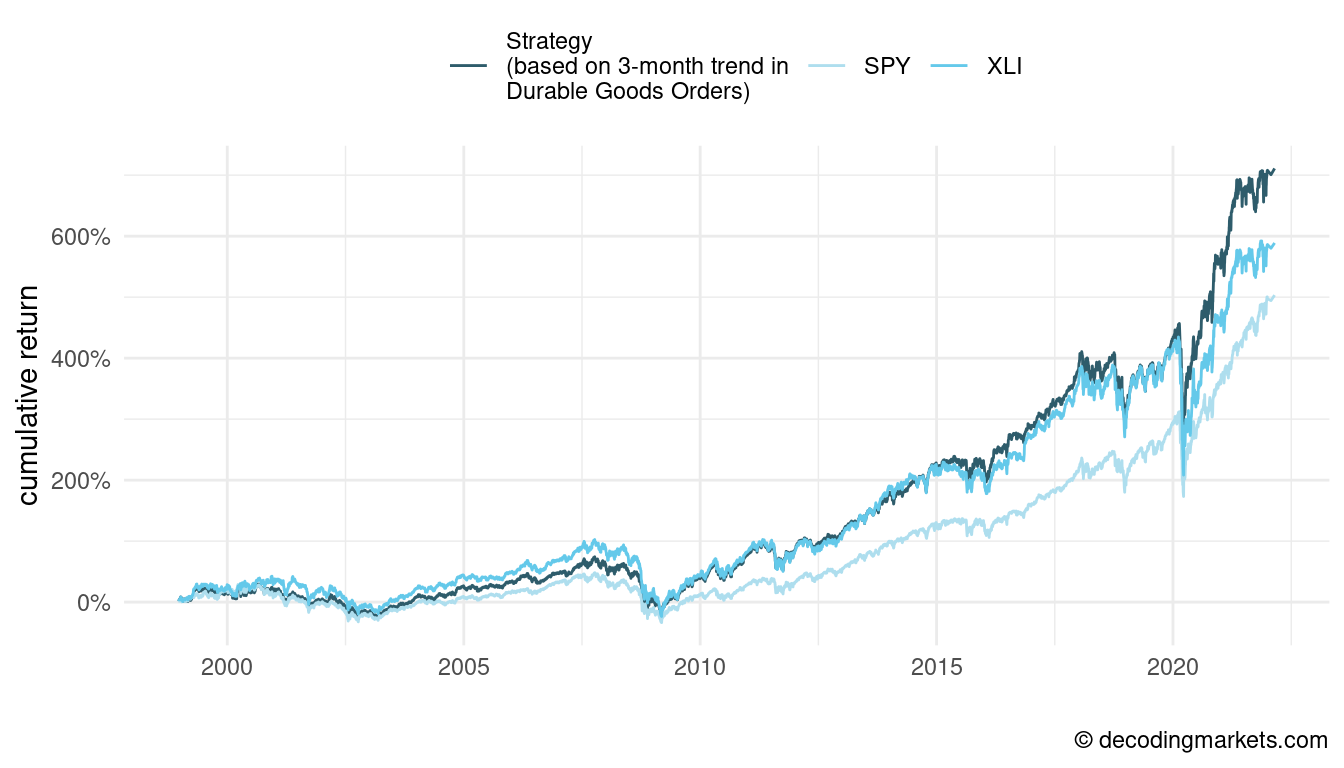
Compared to a buy-and-hold investment in industrials, the strategy has no substantial edge up to 2020. During the Covid crash, the signal indicated to move into the broad market on time, which resulted in an improved overall performance (Sharpe ratio 0.46 versus 0.40 for XLI and 0.42 for SPY).
#5 Yield Spread
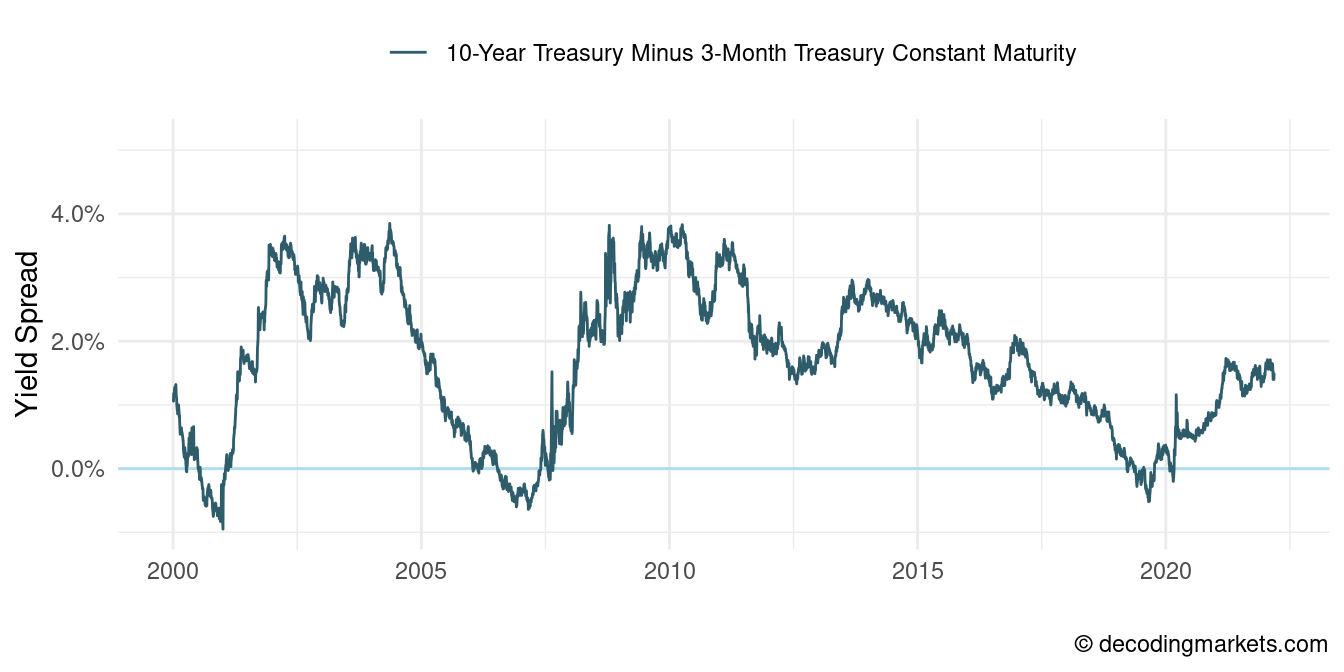
Finally, probably one of the strongest indicators of where the economy is heading: the yield or credit spread. This measures the difference between long-term and short-term treasury bonds yields.
In a nutshell, if long-term yields are well above the short-term yields, the economic future looks bright, and investors are bullish. If, however, long and short-term yields are about equal, or long-term yields even fall below (this is called an inverse yield curve), there is little trust in the economy. Such a scenario is almost certain to lead to an economic slowdown of some kind.
Contrary to the previous indicators, the yield spread is available immediately as it’s directly derived from the yields of the traded treasuries. This is a major advantage and re-computed data can be found here. Below is a chart of the yield spread over time.
While there are many ways of trading the yield spread, such as rotating between stocks and bonds, cyclicals and defensives, or large-caps and small-caps, a pure fixed-income strategy shall be presented here.
The strategy is to invest in long-term US treasuries (TLT) for as long as the yield spread is above 150 basis points (1.5%), and switch to short-term treasuries (SHY) when it falls below that threshold.
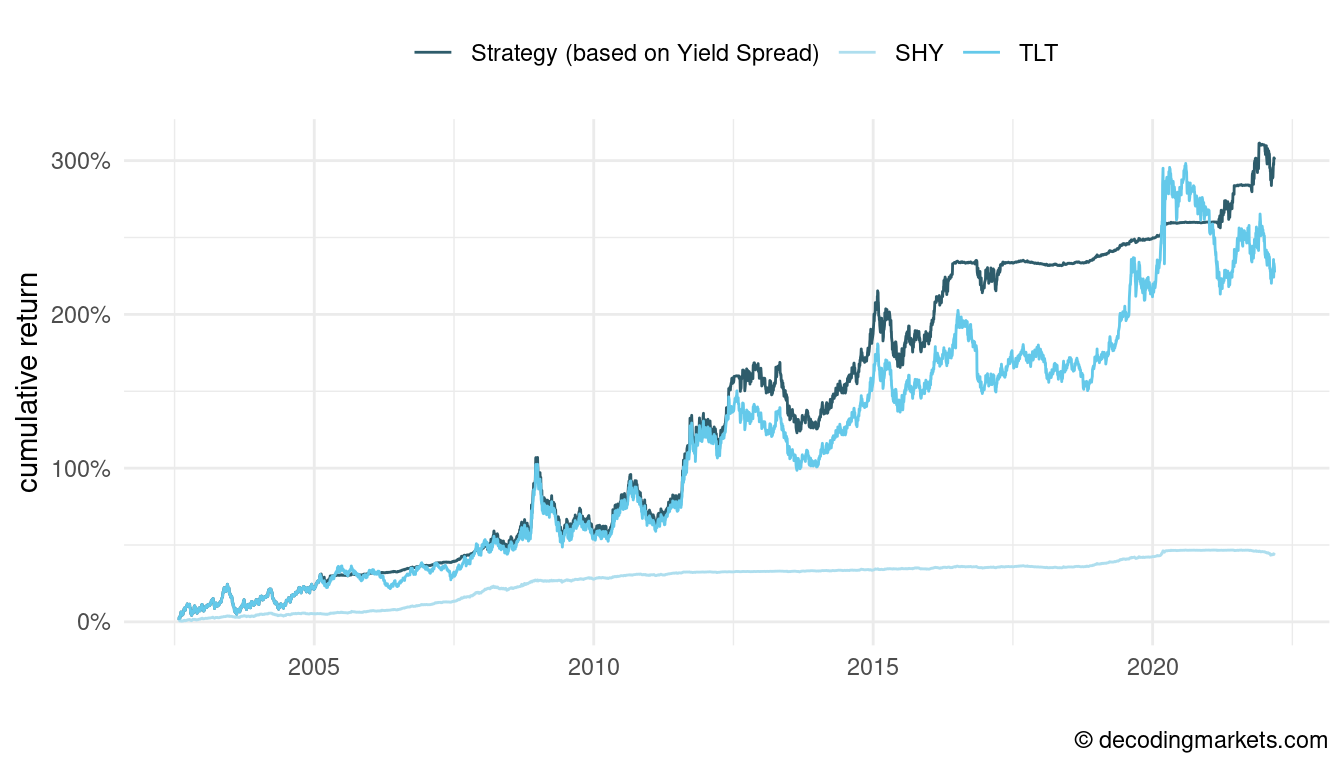
Following this strategy could have avoided much of the price fluctuations in long-term treasuries. This is most notable between 2005 to 2008 and 2017 to 2021. The Sharpe ratio was 0.64 (vs. 0.45 for TLT).
Final Thoughts
These were just a few economic indicators. It’s advisable to keep your eyes open for leading signals that others may not think of. For example, checking slack instead of raw unemployment figures, or retail clothing sales instead of broad retail sales.
The presented strategies are simple and rule-based. Following a signal one rotates between a risk-on and a risk-off asset.
In real trading, one may prefer a more discretionary approach. You could develop more sophisticated ways of playing the indicators. For example to dynamically weight up or down on stocks of certain industries based on how severe a signal seems. You could also combine several indicators for a more robust model.
Hey Joe,
Was curious if you could combine the vehicle sales strategy and swap out XLY with the top 25 stocks from the momentum low p/e, high p/b strategy (https://stocksoftresearch.com/fundamental-data-momentum-investing-strategies/) to see if it would increase the cumulative return percentage at all.